
LISTING
KASE OFFICIAL LIST
As of January 1, 2020, there were 651 securities of 204 issuers in the Exchange’s Official List including 307 securities of 104 issuers on the Main market, 87 securities of 66 issuers on the Alternative market and 257 securities of 38 issuers on the Mixed market.
In 2019, at the initiative of two Kazakhstani brokerage firms, the Official List of the Exchange includes 13 securities of the U.S. companies, four securities of the Russian companies,one issue of GDRs and five issues of foreign government securities (bonds issued by the governments of the Russian Federation, the Republic of Turkey, the Ukraine and the Sultanate of Oman).
Besides, three issues of the Asian Development Bank’s bonds and one issue of bonds of the European Investment Bank were included in KASE lists in 2019 for the first time. In total, 19 bond issues of international financial organizations were listed on KASE in 2019.
In October 2019, bonds of local executive body of Turkestan region issued to finance housing construction as part of the implementation of state and government programs, were included for the first time in the Official List of the Exchange. A total of 22 issues of local executive bonds were included in KASE lists in 2019.
In 2019, 26 meetings of the Listing Commission were held, as a result of which 30 companies (including 12 new companies) were fully listed, 43 issues of securities included in the Official List of the Exchange including: 36 corporate bonds; three ordinary shares; three units of investment funds and one preferred share name.
According to the simplified procedure, 45 issuers (excluding securities of the National Bank of Kazakhstan and the Ministry of Finance of the Republic of Kazakhstan) were listed in 2019. Thus, the Official List of the Exchange includes 71 issues of securities, among them: 22 bonds of local executive bodies; 19 bonds of international financial institutions, 16 common shares; five foreign government bonds, four bonds with the period of maturity up to one year; three corporate bonds, one unit of investment funds and one depositary receipt.
In 2019, 37 bond issues were delisted from the Official List of the Exchange due to maturity, early repayment or annulment of issues. One issue of preferred shares of one issuer was automatically excluded due to its conversion into ordinary shares. In addition, seven issues of shares of six issuers were removed from the Official List of the Exchange at the initiative of their issuers (voluntary delisting) and one issue of shares of one issuer was delisted due to outstanding annual listing fee.
NON-LISTED SECURITIES SECTOR
In 2019, at the initiative of brokerage firms, KASE admitted three issues of shares of three issuers to trading in the Non-Listed Securities sector, two of which were excluded three months later due to the absence of transactions made with these securities at the Exchange's trading sessions for 90 consecutive calendar days.
AUDIT FIRMS
In 2019, four meetings of the Committee on Audit of Issuers of the Exchange’s Board of Directors were held. As a result, two audit firms were transferred from the second to the first level of the List of Audit Firms Recognized by the Exchange. Share trading volume in 2019 dropped by 62.3% to KZT203.6 billion compared to 2018.
The average daily trading volume amounted to KZT827.5 mln, average number of transactions was 420, average volume of one transaction was KZT2.0 mln.
There was one placement in the primary market in 2019. Ferro-Alloy Resources Limited raised £10,435.6 (equivalent to KZT5,198,389.8), placing 14 908 shares at a price of £0,7 (equivalent to KZT348.698) per share during subscription to ordinary shares. Trading volume on the primary equity market dropped by 99.0 % compared to 2018.
Trading volume on the secondary equity market reduced by 62.3% and made up KZT203.6 bn. This significant reduction was largely due to a large volume of major transactions of irregular nature in the secondary market caused by the change of shareholders of several companies and KazMunayGas Exploration Production’s shares buyback.
Рынок
ценных бумаг
SHARES
Fig. 5. Trading volume on the equity market, KZT bn
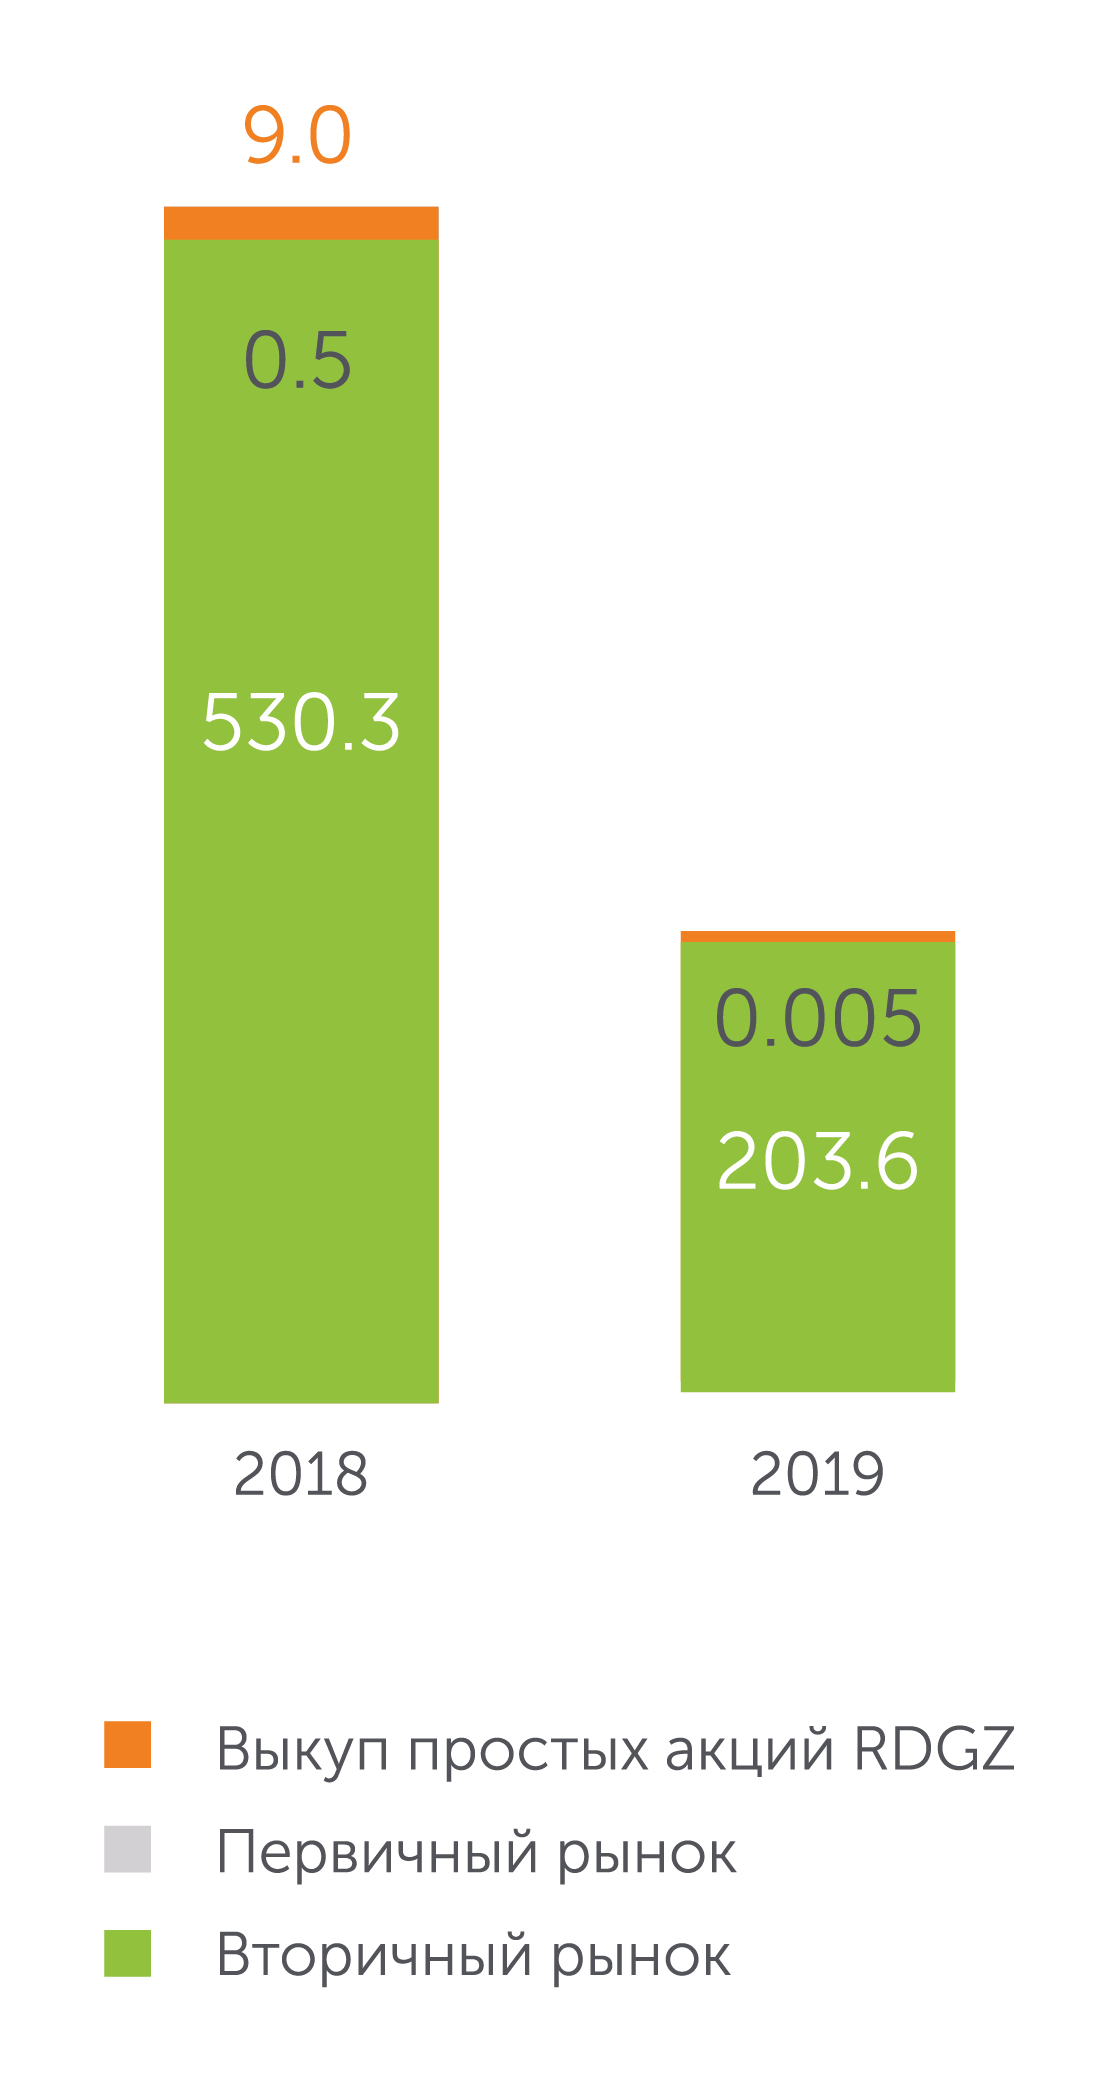
Fig.6. Shares of Major Investors Categories on Equity Market
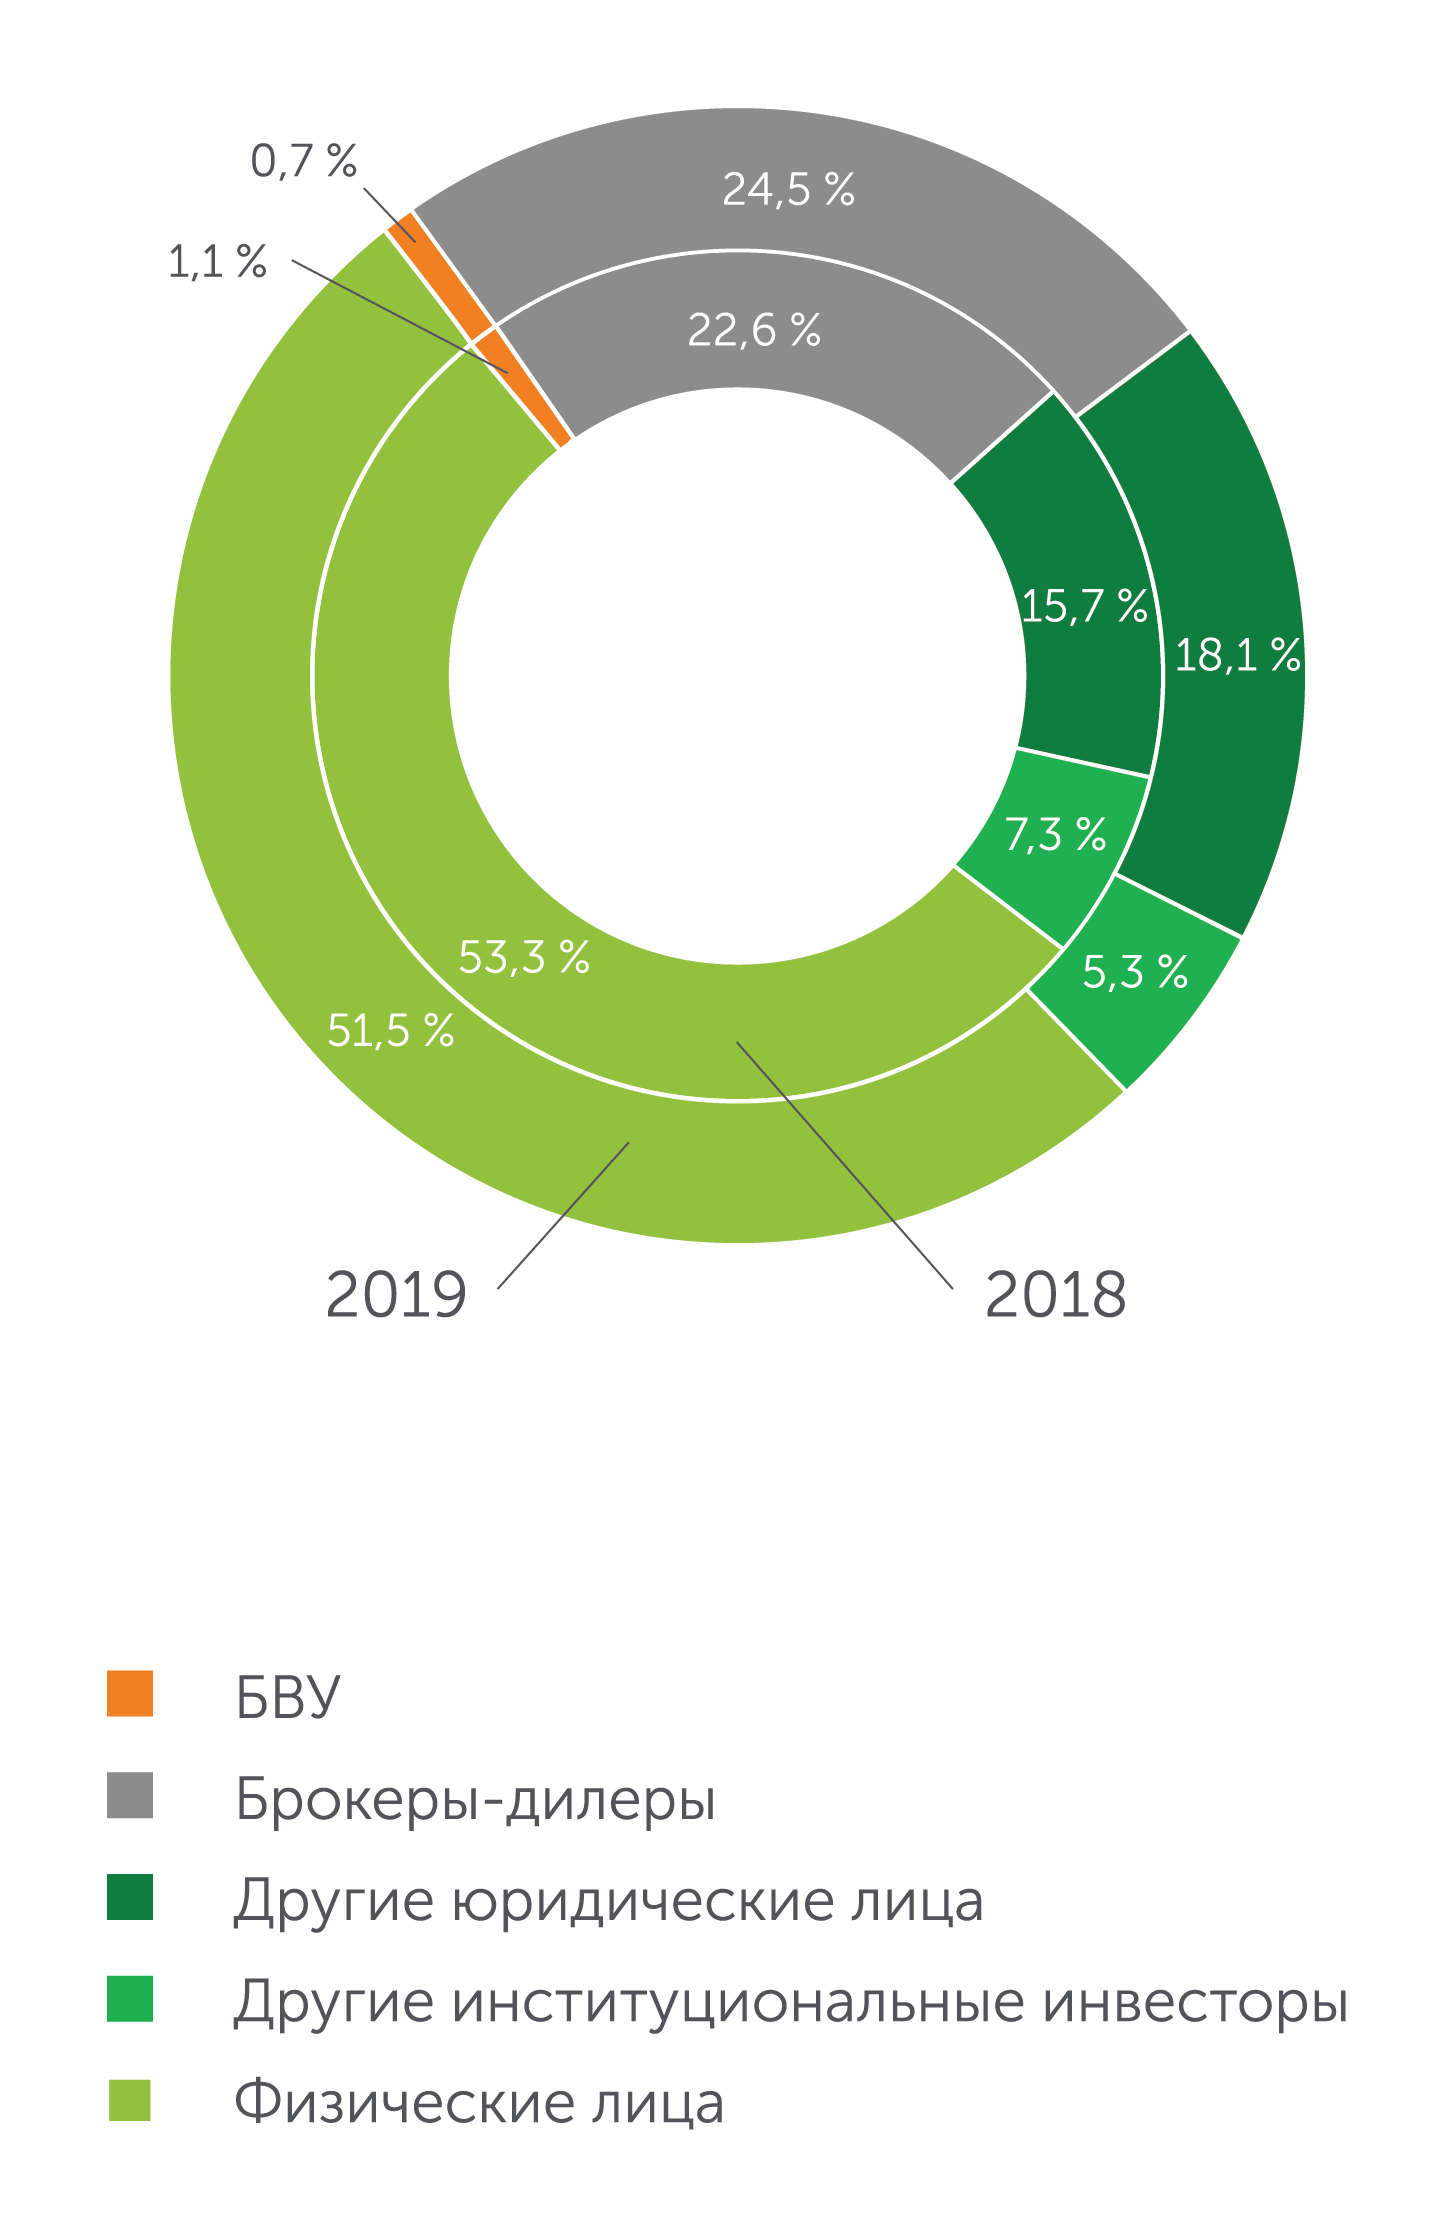
Individuals remain the most active investors in secondary market among main types of investors; their share accounted for 51.5% of the total gross turnover of share trading. The share of second-tier banks (STBs) was 0.7%, roker-dealers accounted for 24.5%, other institutional investors accounted for 5.3%, and the share of other legal entities was 18.1%. The share of non- residents amounted to 20.3%.
KASE Index rose by 2.6 % to 2,363.79 points in 2019. Total trading volume of index shares amounted to KZT108.4 bn, down 36% compared to the same period of 2018.
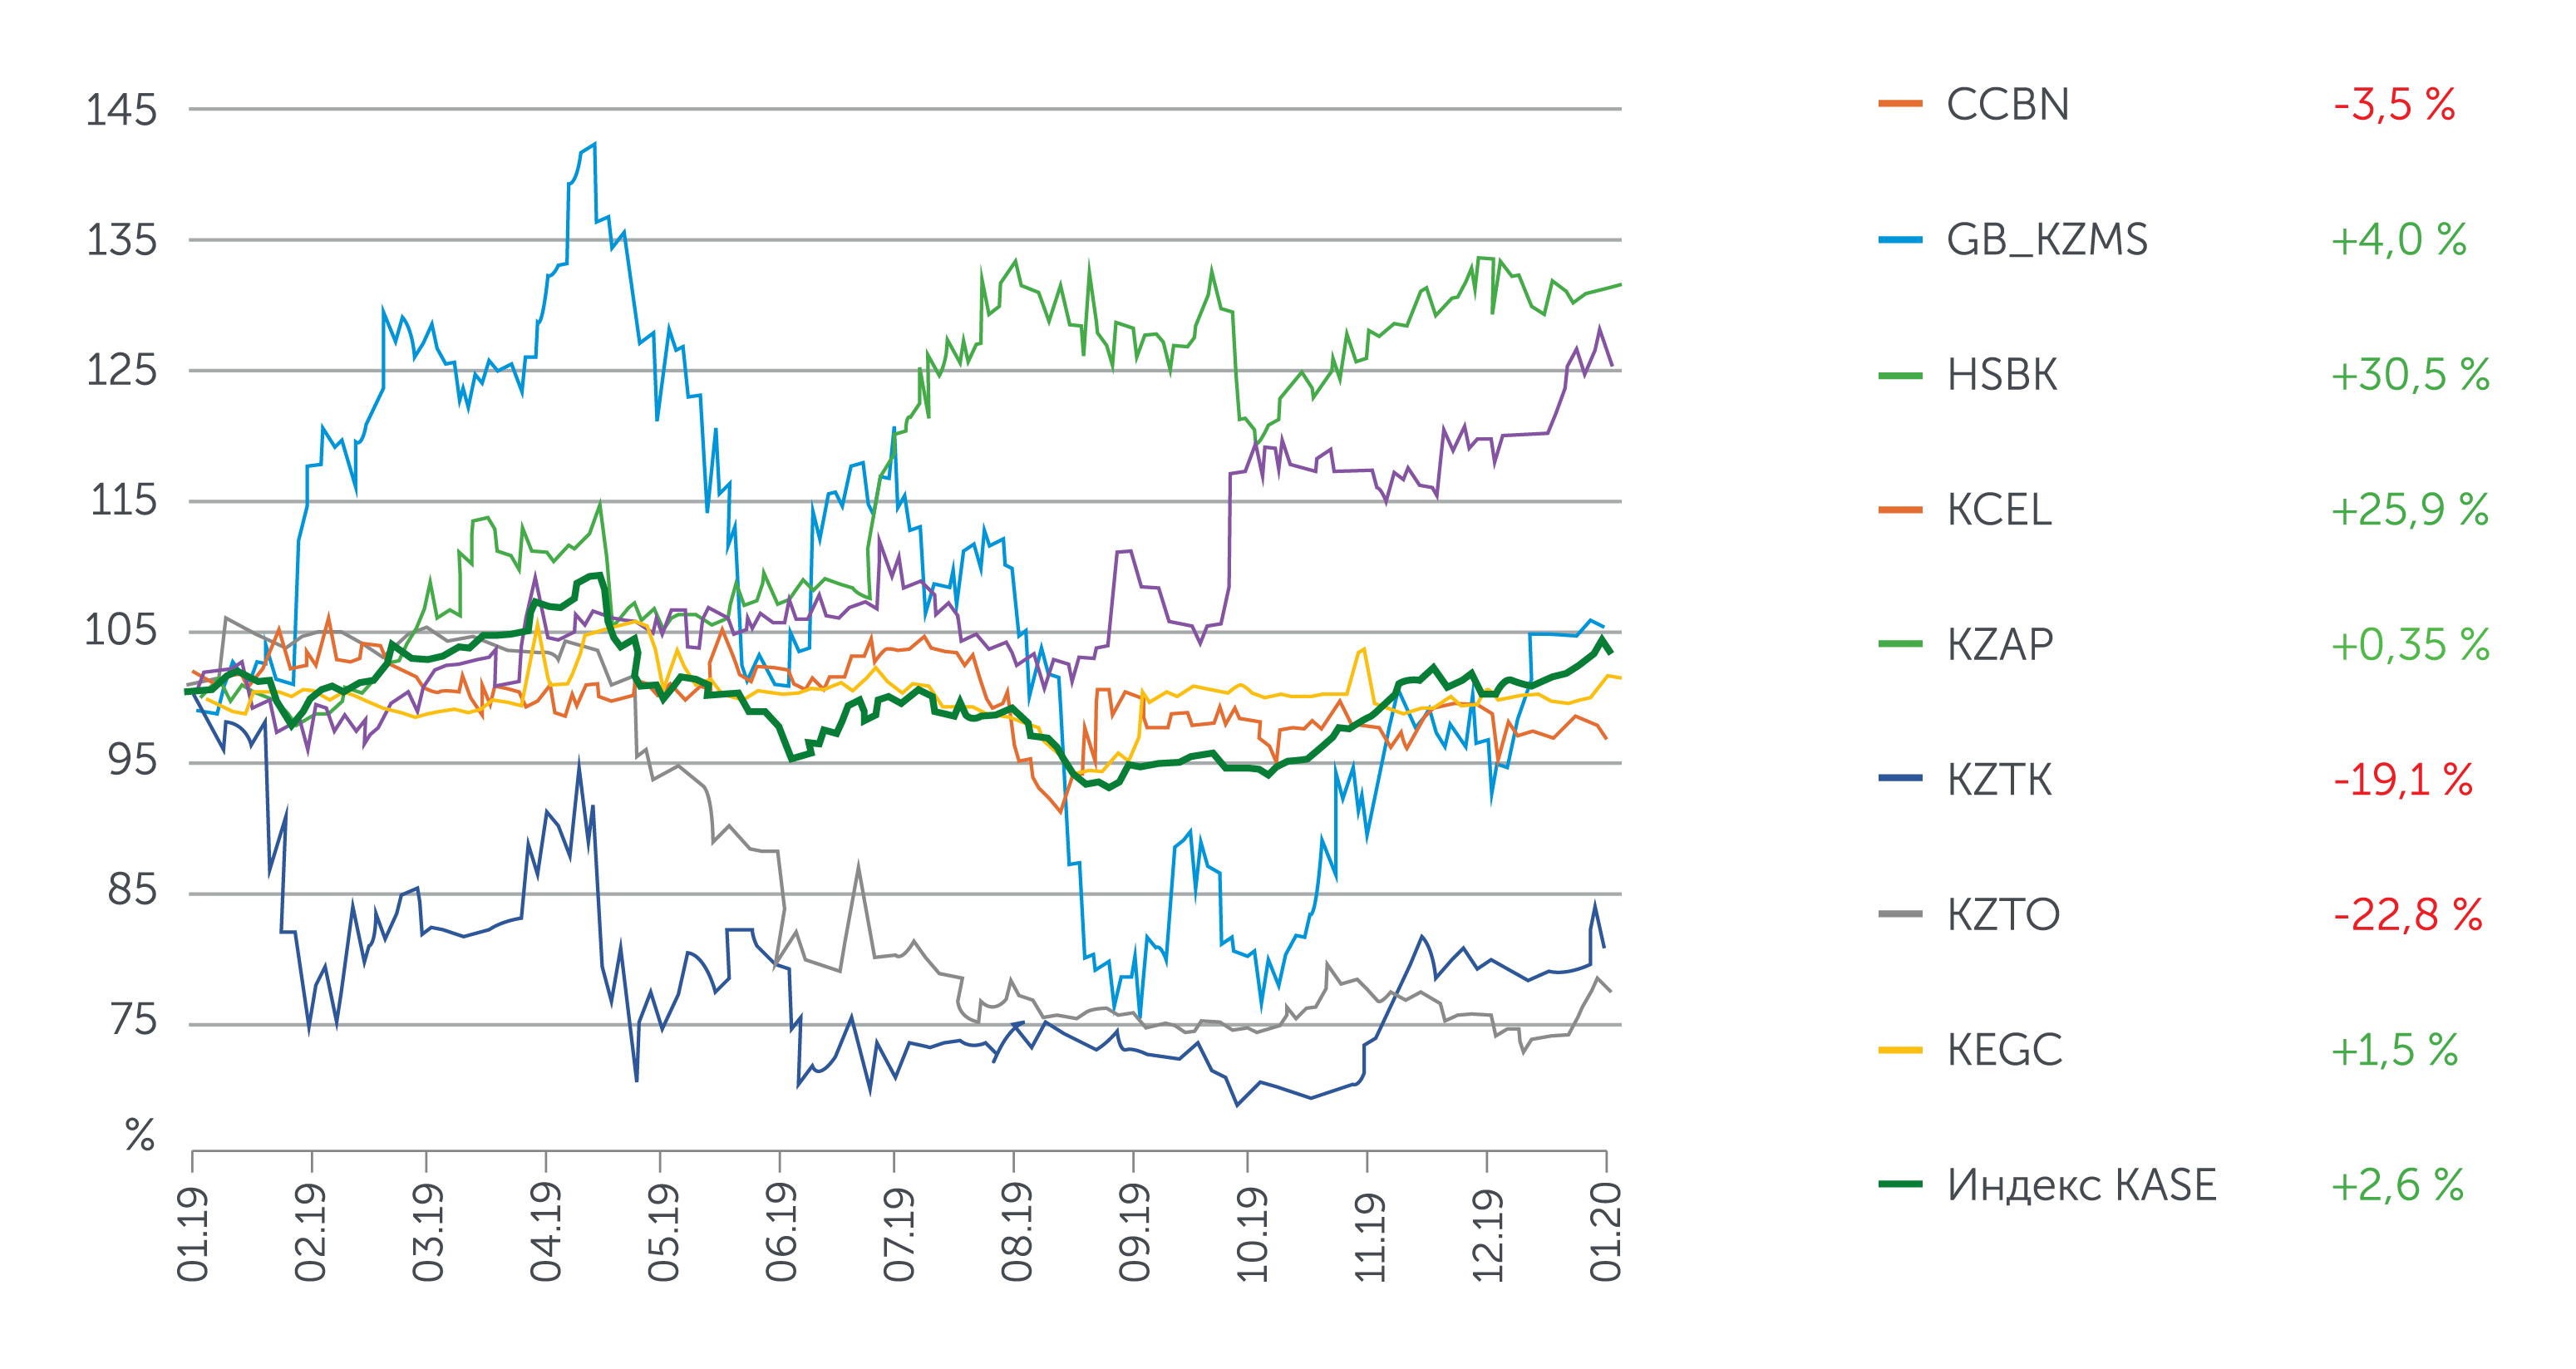
In 2019, the shares of Kazatomprom National Atomic Company were included in the KASE Index representative list. Thus, at the end of the reporting year, the KASE Index included shares of eight names. Halyk Savings Bank of Kazakhstan’s securities grew most of all among index stocks at the end of the reporting year. The issuer holds the largest share in the banking services market after the acquisition of Kazkommerzbank and has consistently high profitability and high level of capital adequacy. In January-June 2019, Halyk Savings Bank of Kazakhstan received a consolidated net profit of KZT164.2 bn according to IFRS, which is 1.9 times more than in January-June 2018. In addition to the favourable operating results of the bank, the investor community reacted positively to the renewal of its dividend policy. Late June, the news broke that the Board of Directors of the Halyk Savings Bank of Kazakhstan approved changes and amendments to the bank's dividend policy, according to which at least 50% and up to 100% of the consolidated annual net income of the bank will be spent on dividends (earlier, it was from 15% to 50%).
Kcell`s shares, which rose by 25.9 %, rank the second in terms of price growth. The potential to increase the company's revenues due to the strengthening of the strategic position in the market is among the main positive factors driving the company's shares up. The company's entry into the Kazakhtelecom structure has created more stable environment with a stronger emphasis on quality of services.
KEGOC`s share price rose by 1.5 % in 2019. At the end of the first half of the year, the company reported a 48% increase in revenues to KZT191 bn compared to the same period of 2018, while net profit for the period under review decreased by 7% to KZT29.7 bn. Revenue growth was based more on revenues of KZT52 bn from new type of services (ensuring capacity readiness for load), as well as thanks to moderate revenue growth in other areas.
The largest price decline in 2019 was recorded on shares of Kazakhtelecom (-19.1%) and KazTransOil (-22.8%).
Fig. 7. Movement of the KASE Index in 2017-2019, %
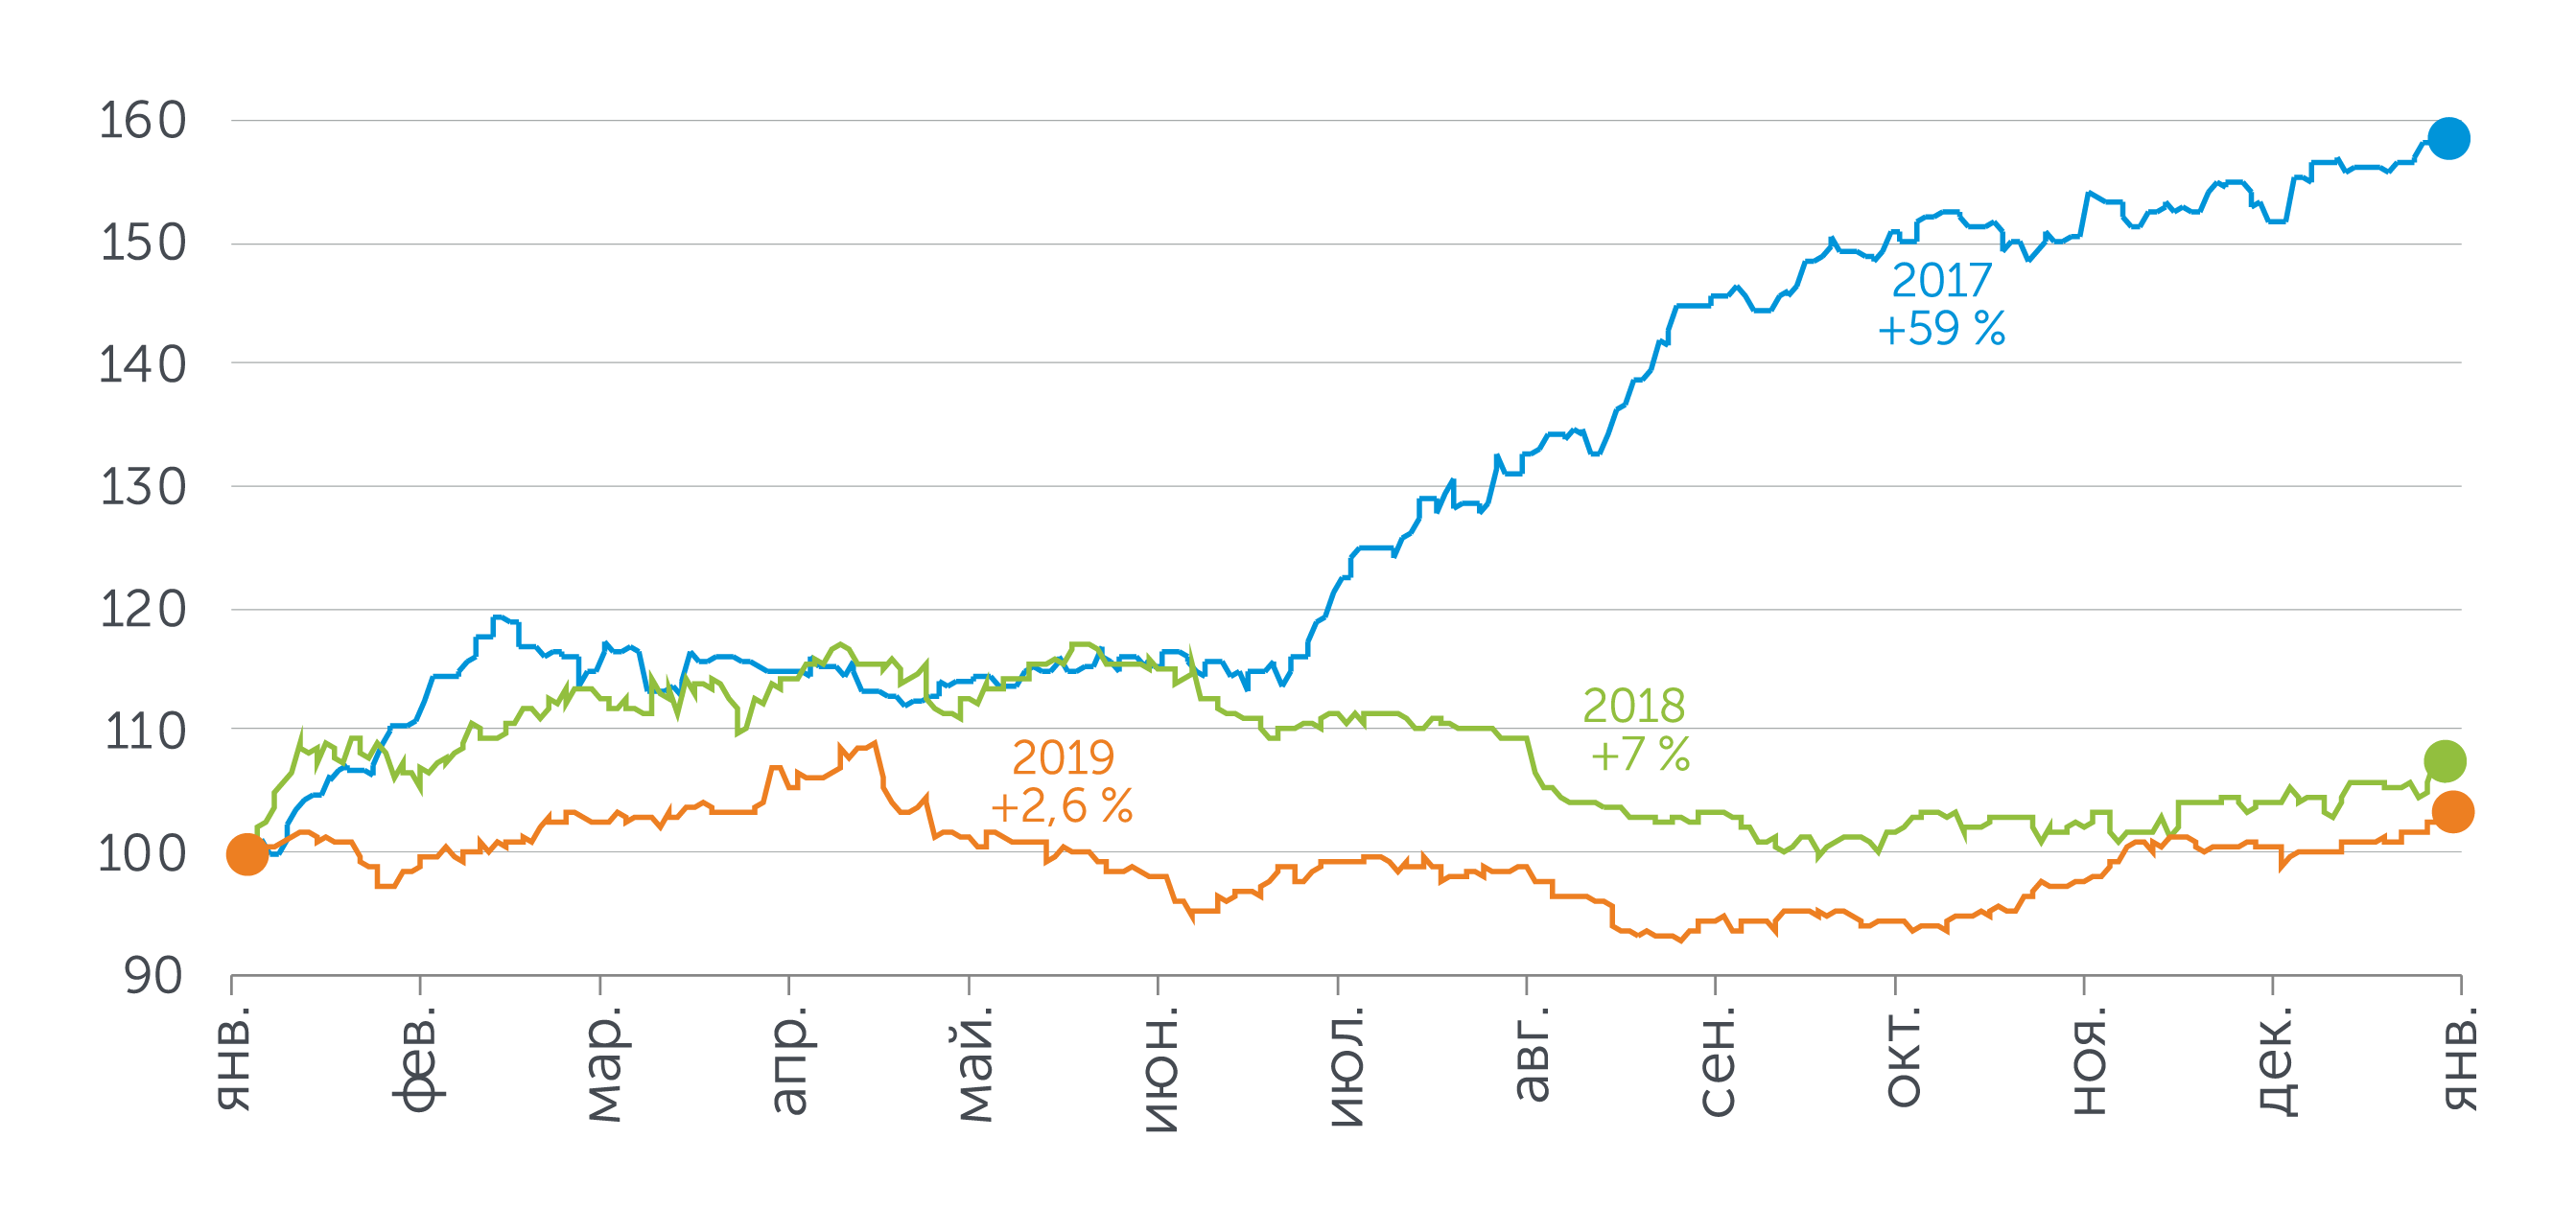
Fig.8. Dynamics of KASE Index Components, %
The prices of ordinary shares of the national telecom operator Kazakhtelecom in the reporting year were subject to high volatility amid a number of important corporate news. Investors differently assess position of the company taking into account large-scale capital expenditures, growing equity trading volume and attracting additional external financing in the form of bonds.
The share price began to recover in November 2019 amid publication of strong interim financial statements. For the nine months ended September 30, 2019, Kazakhtelecom's revenue increased by 90% to KZT298.6 bn compared to the same period of 2018. Revenue growth was mainly due to the growth of income from mobile telecommunications. IFRS net profit rose by 26.6%.
The shares of KazTransOil were under bears’ pressure during the reporting year due to the release of a number of negative corporate news. The main reason for the negative reaction of the market was the inconsistency of the volume of dividend payments, which in 2019 for the first time since the IPO have not increased, with the expectations of shareholders.
Equity market capitalization rose by 11.2% to KZT17.2 trillion in 2019. The change in the indicator was due to the inclusion of shares of a number of companies in the calculation of this indicator and a significant increase in the share prices of some items.
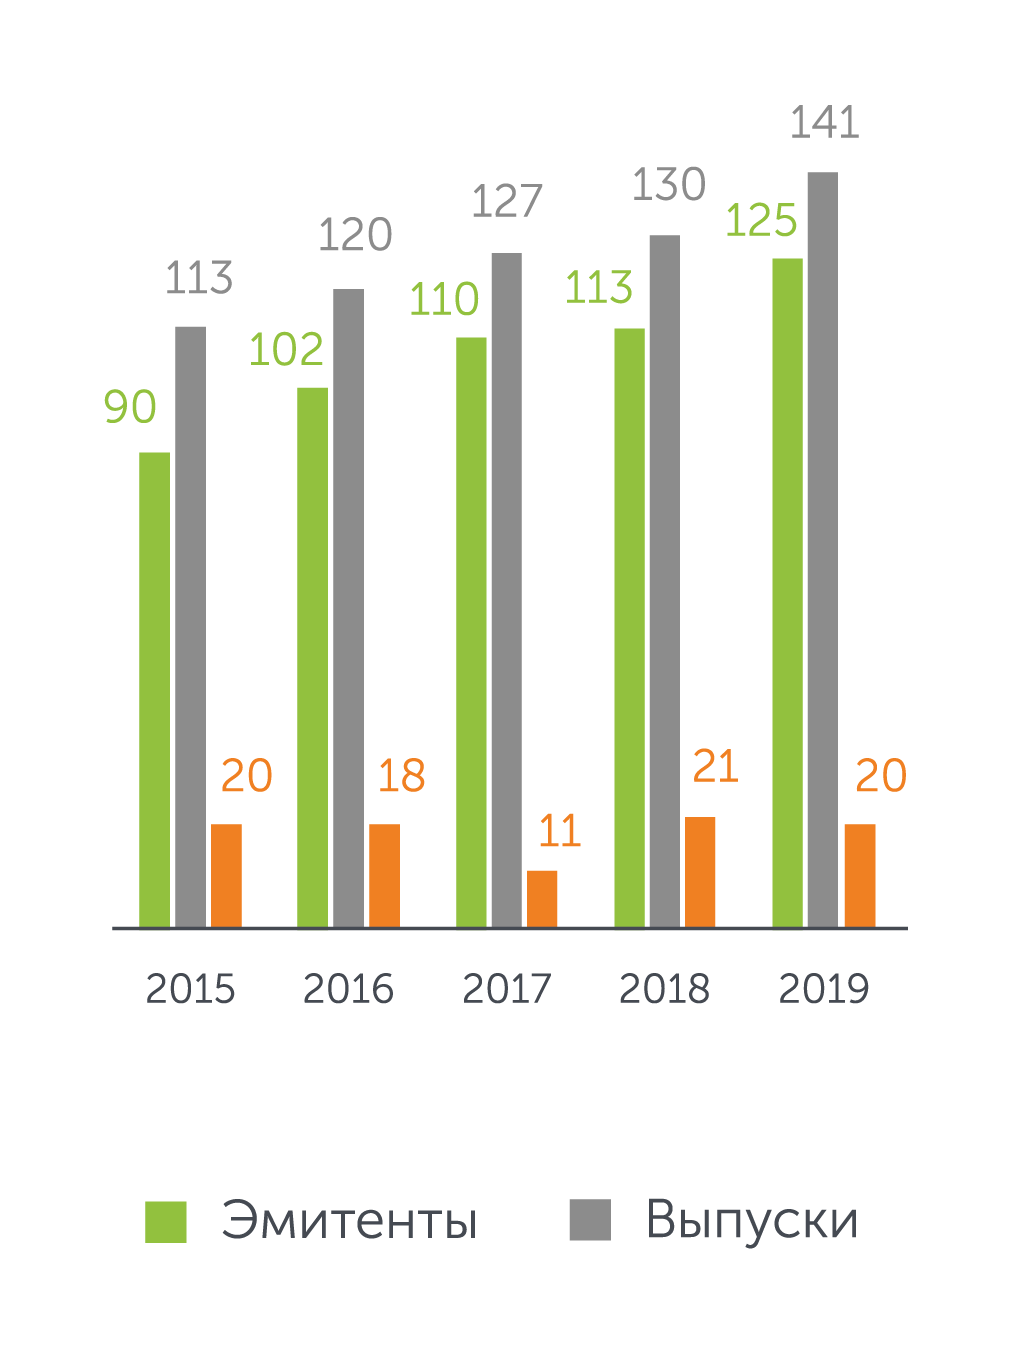
Fig. 9. Dynamics of the number of listed shares over the past 5 years
CORPORATE BONDS
Total trading volume on KASE corporate bond market in 2019 amounted to KZT2.7 trillion having increased by 17.6% or by KZT406.1 bn compared to 2018. The increase of volume was observed both at the primary and the secondary markets.
The average daily volume amounted to KZT11,038.9 mln (KZT3,097.1 on the secondary market); average number of transactions was 11, average volume of one transaction was KZT1,004.3 mln (KZT325.5 mln on the secondary market).
A total of 42 bond issues of 27 issuers were placed on the KASE market. The total volume of funds raised reached KZT2 trillion and grew by 5.1% or by KZT95.5 bn. Market rates of amounts raised ranged from 9% to 12.0% APR.
Main categories of investors on the primary corporate bonds market were as follows: the share of STDs accounted for 18.3%, broker-dealers – 1.5%, other institutional investors – 75.5%, other legal entities – 3.7%, individuals – 0.9 %. The share of non-residents was 8.9%.
Fig. 10. Trading volume on the corporate bond market, KZT bn
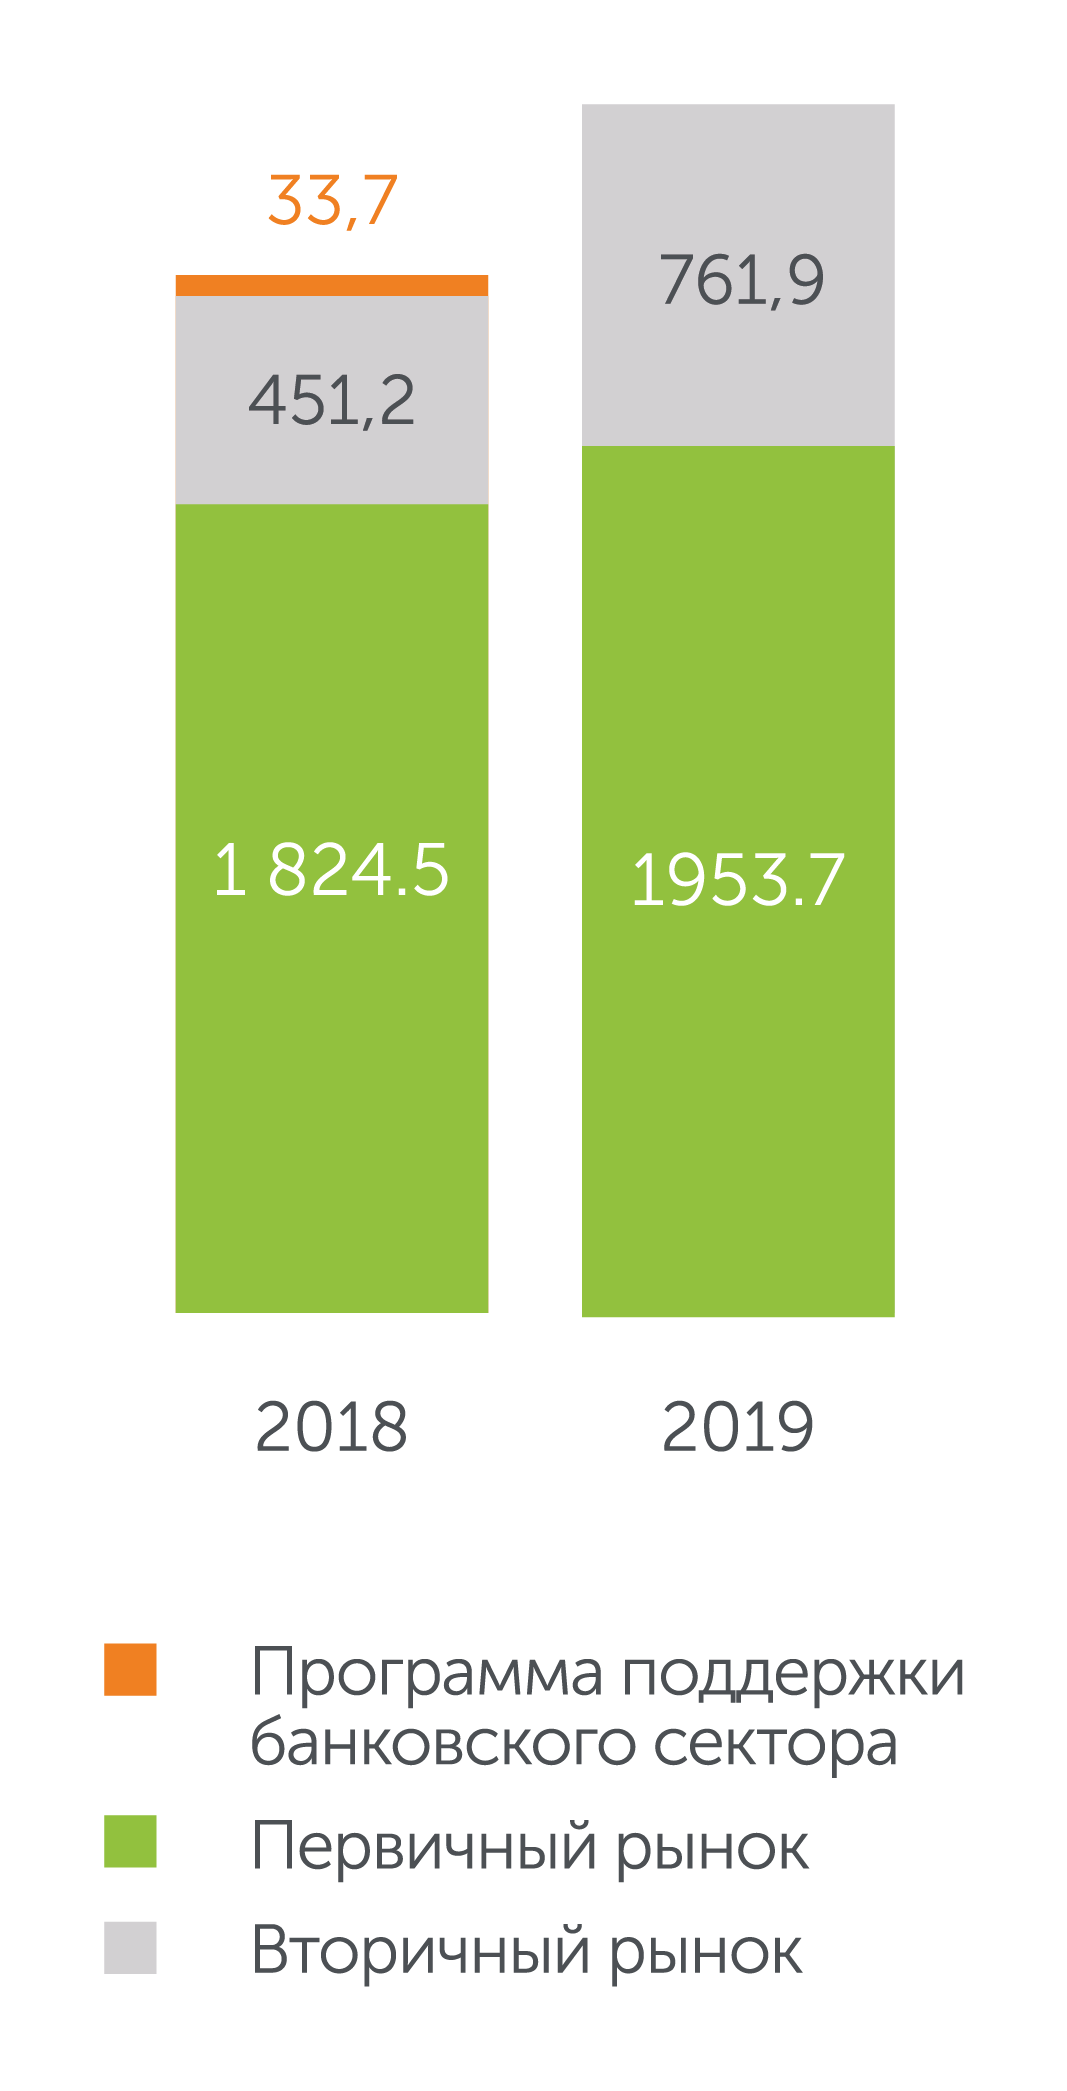
Fig.11. Shares of main investor types in the secondary corporate bond market, %

The volume of trading on the secondary corporate bond market increased by 68.9% to KZT761.9 bn in the reporting year. In terms of the main categories of investors, the largest share of the total gross turnover was taken by STDs that accounted for 37.3%, legal entities ranked the second with 32%, other institutional investors – 27.2%, brokers-dealers – 2.6%. The share of individuals in this market segment amounted to 1%. The share of non-residents amounted to 1.7%.
GOVERNMENT SECURITIES (GS)
The trading volume of government securities on KASE amounted to KZT1.8 trillion and rose by 10.9% compared to 2018.
The average daily volume amounted to KZT7,413.4 mln (KZT1,532.8 mln on the secondary market); average number of transactions was four, average volume of one transaction was KZT2,056.0 mln Program to support the banking sector Secondary market Primary market (KZT591.0 mln on the secondary market).
In 2019, the primary market reached KZT1.4 trillion, which is 69.5% higher than in 2018. Of these, KZT108.9 billion was raised by local administration of 14 regions, cities of Nur-Sultan, Almaty and Shymkent as part of state and government programs.
Fig. 12. The volume of trades on the government bond market, KZT bn

The amount raised by the Ministry of Finance on the KASE market came to KZT1.3 trillion. This amount corresponded to the targeted amount of borrowing for 2019 and is higher than in 2018 by KZT592.3 bn (80%). The yield on the Ministry of Finance’s placements ranged from 8.46% to 9.9% APR. The maturity of the bonds placed is from two to 20 years.
Main categories of investors on the primary market were as follows: the share of STDs accounted for 0.6%, other institutional investors – 91.4%, other legal entities – 8%.
Trading volume in the secondary market dropped by 52.4% or KZT414.3 bn to KZT377.1 bn. The share of trading in notes of the National Bank on the secondary market amounted to 89% of the total turnover of trading against 85.5% in 2018, while the volume of outstanding notes decreased slightly to KZT3.4 trillion.
Since September 2019, foreign government securities - bonds of the Ministry of Finance of the Ukraine, the Republic of Turkey and the Sultanate of Oman - have been included in the Official List of the Exchange. The volume of transactions with these bonds reached KZT686.9 million, 81 deals were concluded.
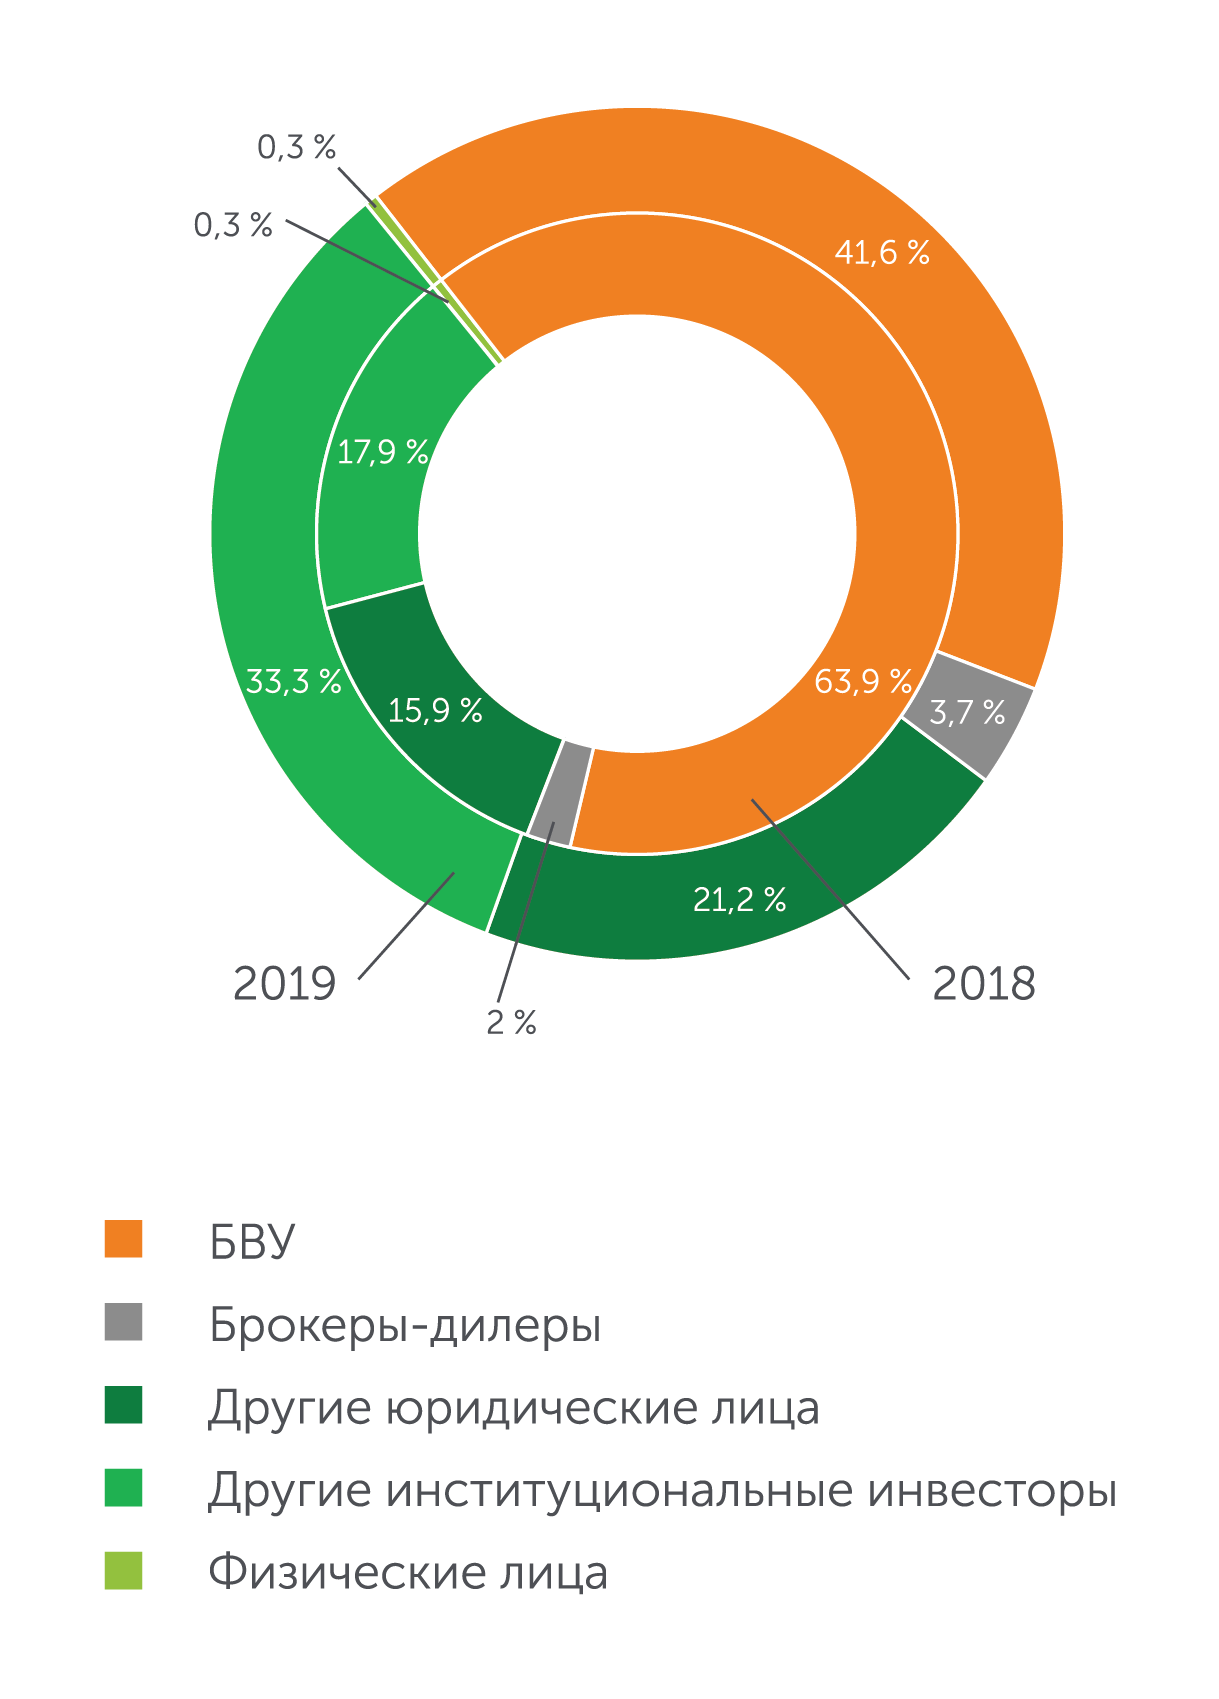
Main categories of investors on the secondary market were as follows: the share of STDs accounted for 41.6%, broker-dealers – 3.7%, other institutional investors – 33.3%, other legal entities – 21.2%, individuals – 0.3%. The share of non-residents amounted to 0.1%.
Fig.13. Shares of main investor types in the secondary goverment securities market, %
There were 30 bond issues of five international financial institutions in KASE trading lists as at the end of the reporting period: the Asian Development Bank, the Eurasian Development Bank, the European Bank for Reconstruction and Development, the European Investment Bank, the International Finance Corporation (IFC).
In 2019, the volume of trading amounted to KZT540.2 bn, which is 5.3 times higher than in 2018.
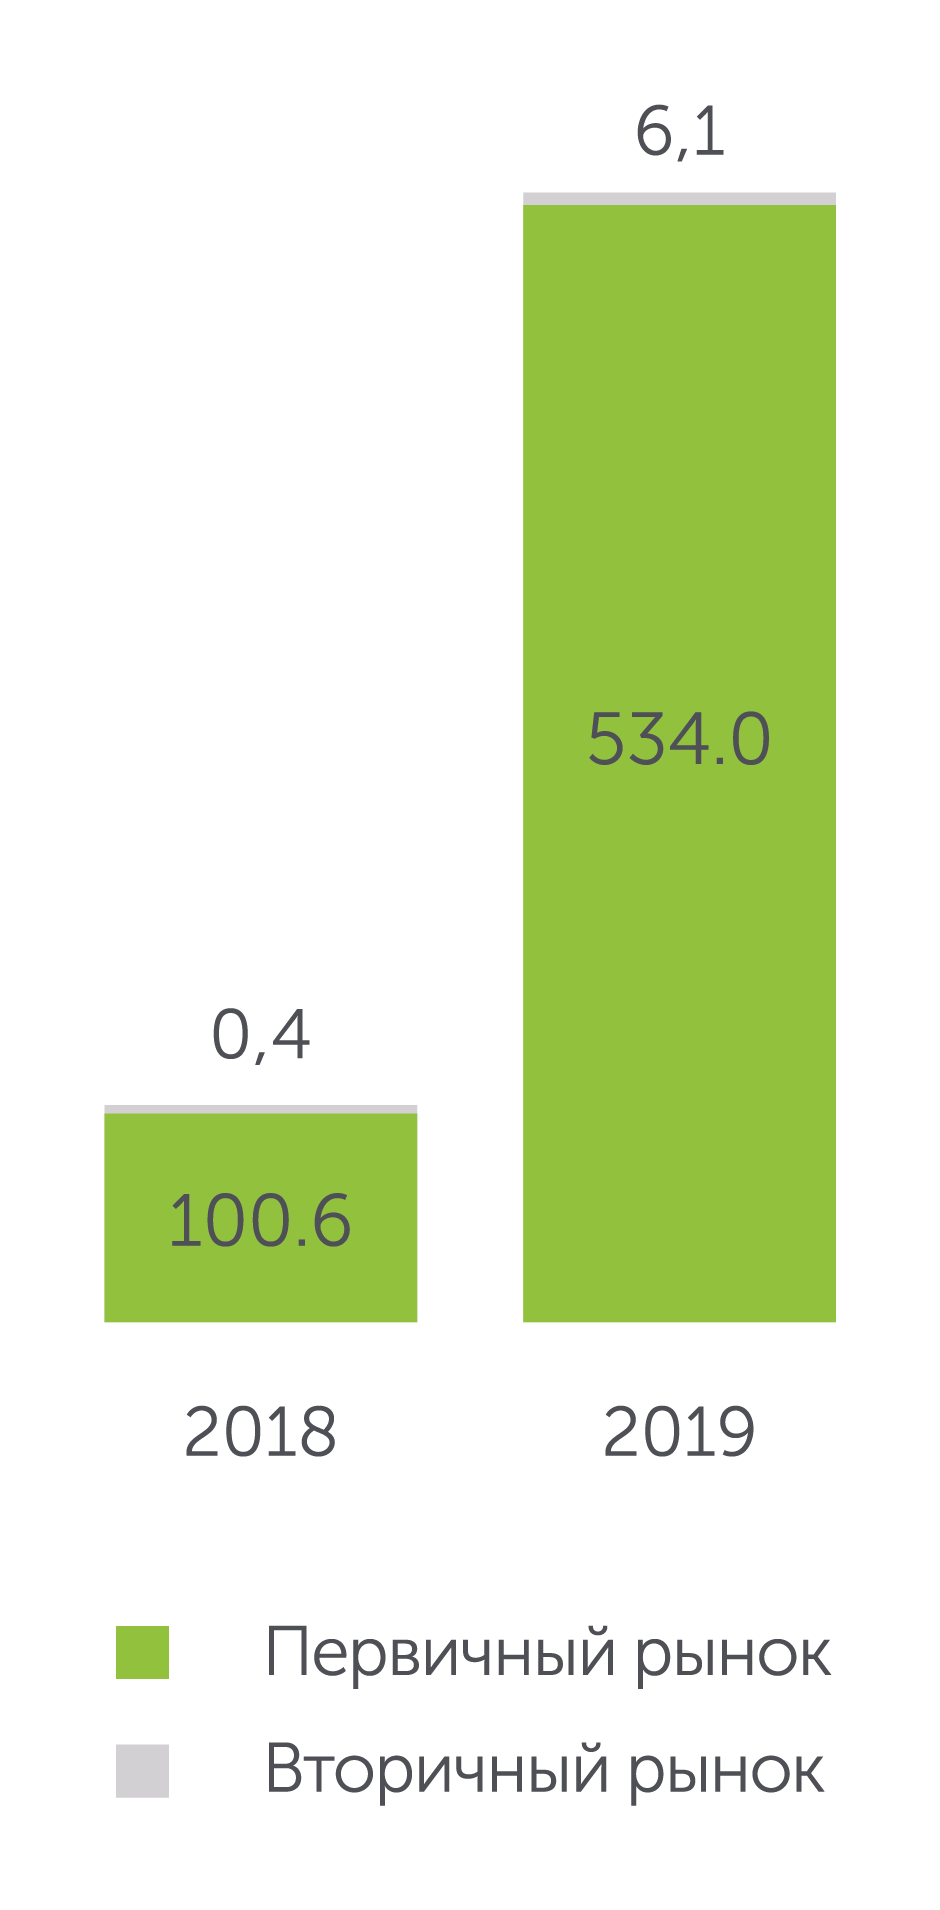
Trading volume on the primary market reached KZT534.0 bn. During the year, the Asian Development Bank raised KZT45.9 bn and placed one issue of seven-year and two issues of five-year bonds setting a margin of 1.3%, 1% and 1.5% APR above inflation rate, respectively. The International Finance Corporation raised KZT32.4 bn through subscription on KASE by selling two issues of two-year international bonds at 8.95% APR and 9.5 % APR. The Eurasian Development Bank raised KZT79.8 bn by placing three-year, five-year bonds and three-month discount bonds at 9.7%, 9.5% and 9.2032% APR, respectively. The European Bank for Reconstruction and Development raised KZT376.0 bn through subscriptionby placing five-, six-, seven- and eight year international bonds with a margin of 1.0–1.5 % APR.
The volume of trading on the secondary market amounted to KZT6.1 bn; 16 transactions with the bonds of the Eurasian Development Bank and three transactions with IFC bonds were concluded.
Fig. 14. Trading volume on the IFI bond market, KZT bn
In total, there were the following main types of investors on this market sector: the share of STDs accounted for 3.1%, broker-dealers – 0.2%, other institutional investors – 85.6%, other legal entities – 11.0%. The share of individuals in this market segment was less than 0.1%.
Fig.15. Share of main categories of investors on IFI market, %

SECURITIES OF INVESTMENT FUNDS
As at the end of 2019, there were 11 instruments managed by eight companies in the sector "Securities of investment funds".
During 2019, KASE Official List included three issues of units and one ETF: units of IMIF GoodWill managed by Freedom Finance, units of IMIF Protsentny and IMIF Liquidny managed by First Heartland Jysan Invest and shares of US78468R6633 SPDR Bloomberg Barclays 1-3 Month T-Bill ETF issued by the investment fund SPDR Series Trust (USA).
Fig. 16. The volume of transactions on the securities market, investment funds in breakdown by instruments, KZT mln
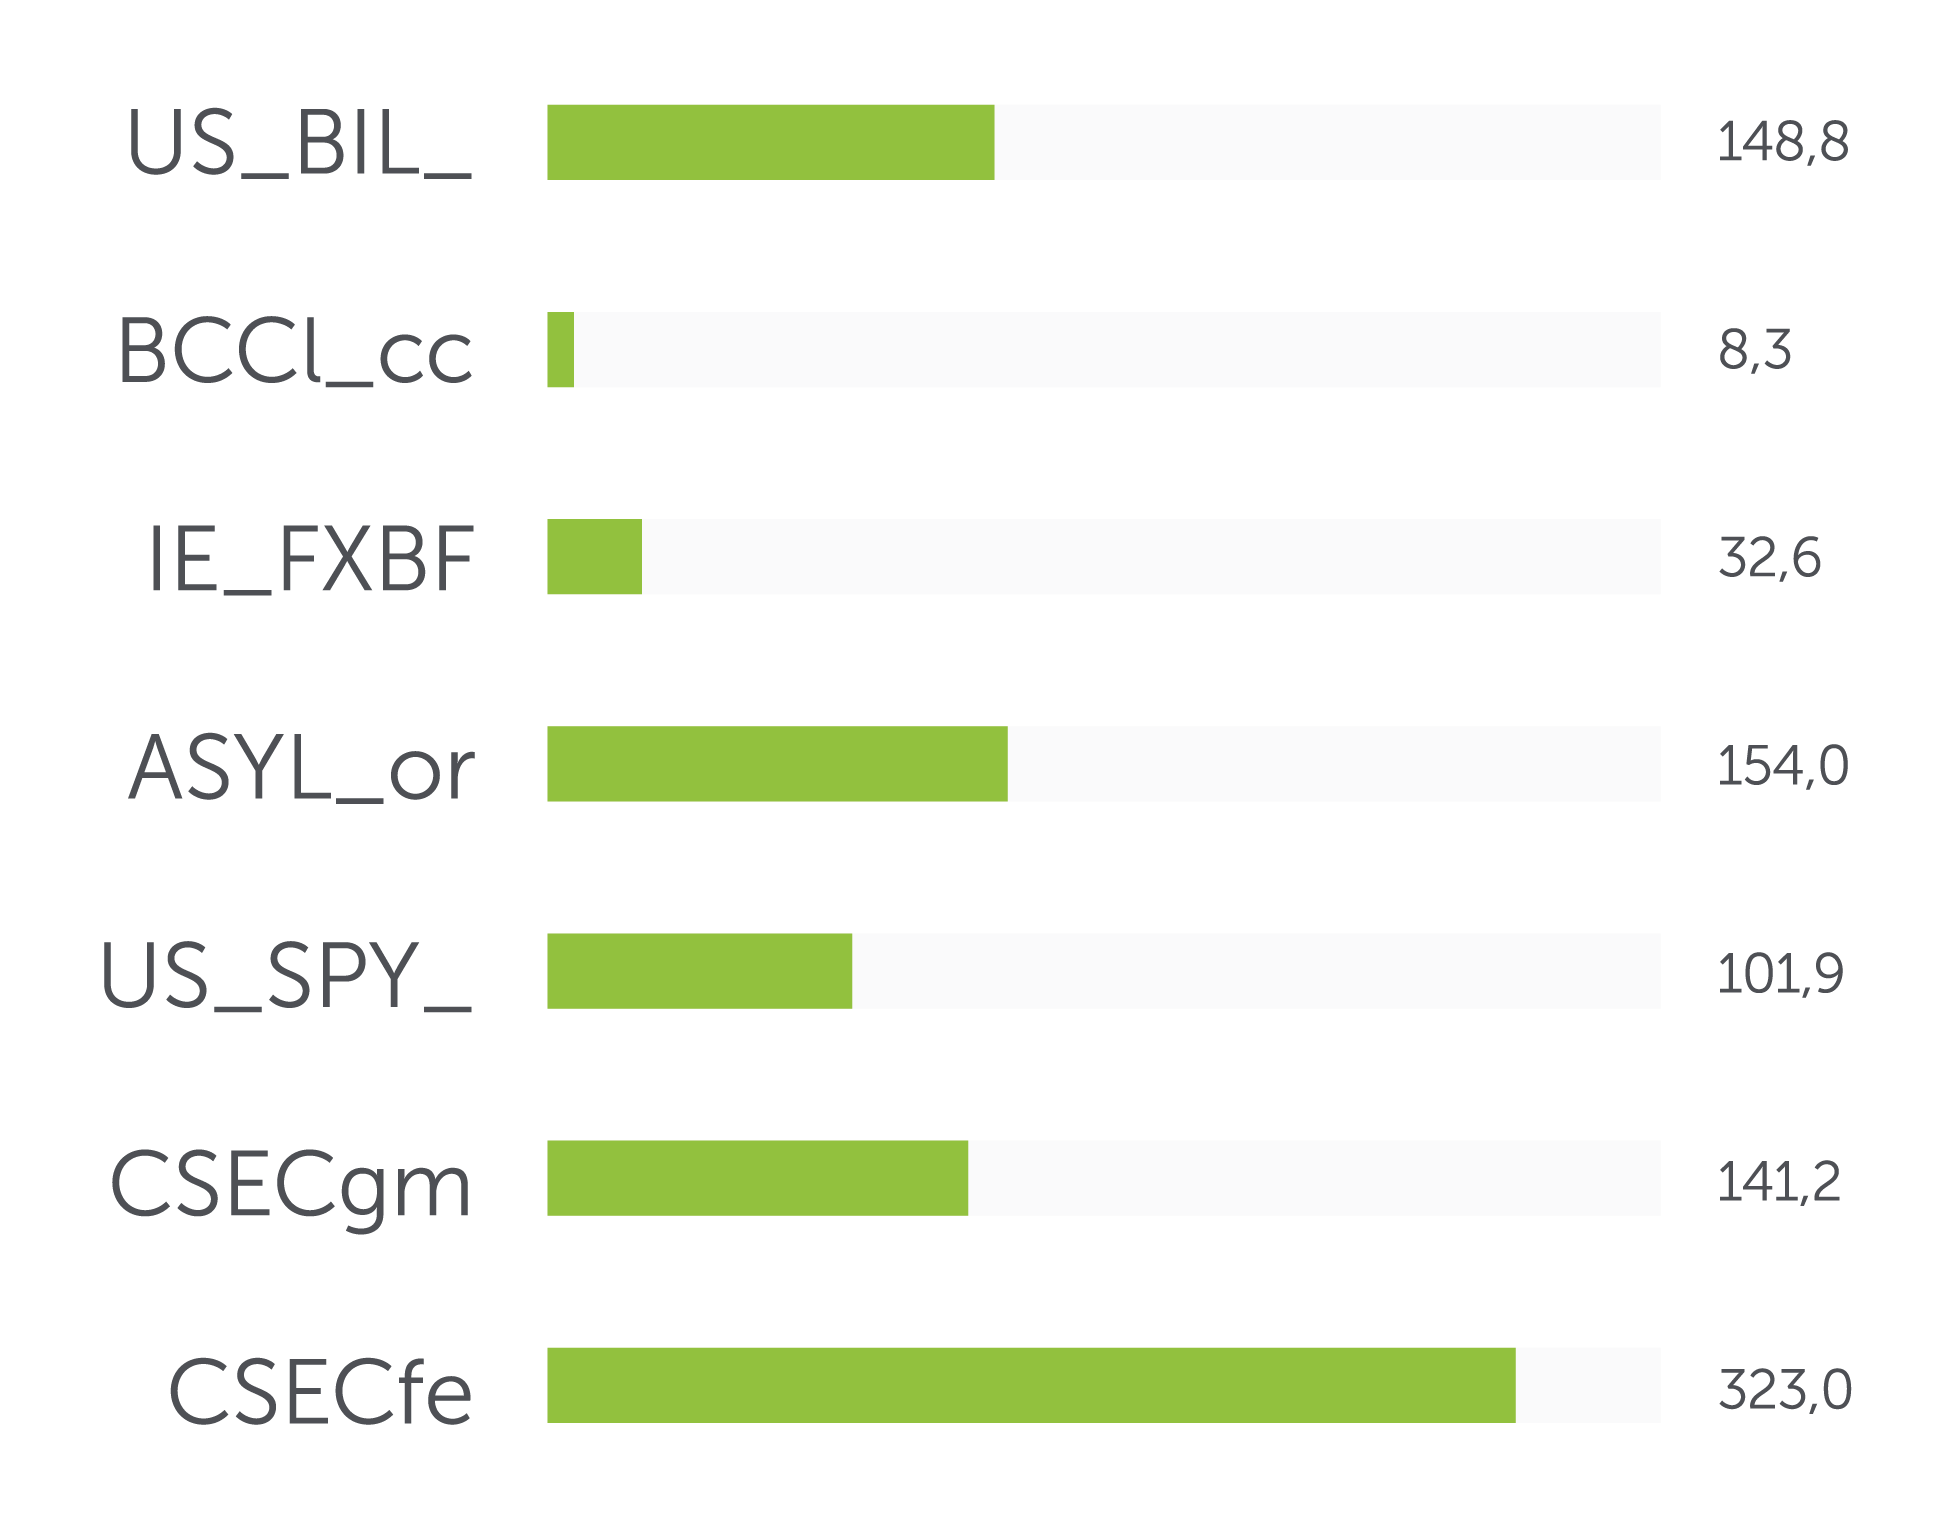
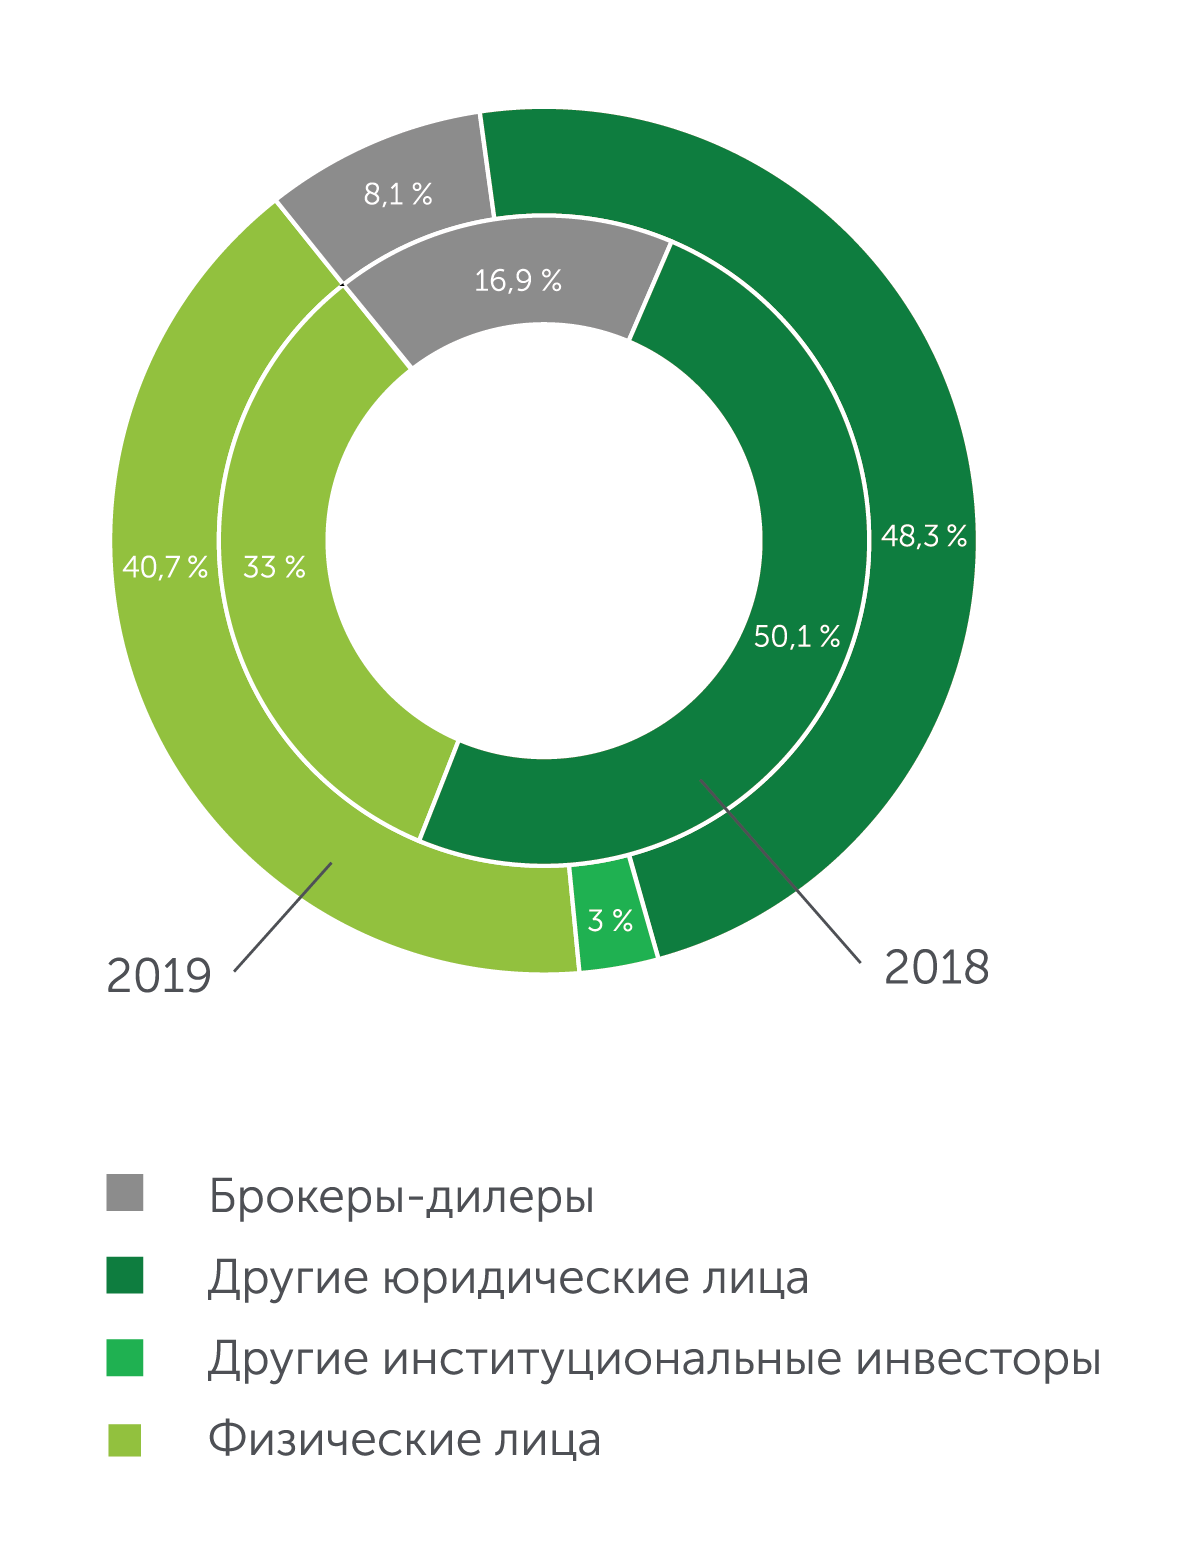
Fig.17. Shares of main types of investors in the total gross turnover of trading in securities of investment funds, %
In the reporting year, the volume of trading amounted to KZT909.9 bn, which is 21 times higher than in 2018.
The leaders in terms of volume were units CSECfe managed by Centras Securities, with which 56 deals with the volume of KZT323.0 mln were concluded; units ASYL_ or managed by Freedom Finance ranked the second; shares of SPDR Bloomberg Barclays 1-3 Month T-Bill ETF ranked third.
Main categories of investors were as follows: individuals accounted for 40.7%, broker-dealers – 8.1%, other institutional investors – 3%, other legal entities – 48.3%.
MONEY
MARKET
Total trading volume of money market reached KZT101.7 trillion having declined by 7.1% or by KZT7.8 trillion compared to the same indicator of the last year.
REPO TRANSACTIONS
The total volume of repo transactions for 2019 amounted to KZT72.7 trillion, which is less than the volume of 2018 by KZT3.1 trillion or by 4.2%. Significant part of repo transactions, more than 97%, were represented by the GS basket auto repo transactions.
Average daily volume of repo transactions reached KZT295.6 bn.
The GS basket auto repo transactions with the CCP and direct repo transactions with the CCP emerged in the Exchange’s trading system due to the launch of the Central Counterparty services (CCP) on KASE. The volume of these transactions in December amounted to KZT12.1 bn and KZT3.3 bn, respectively.
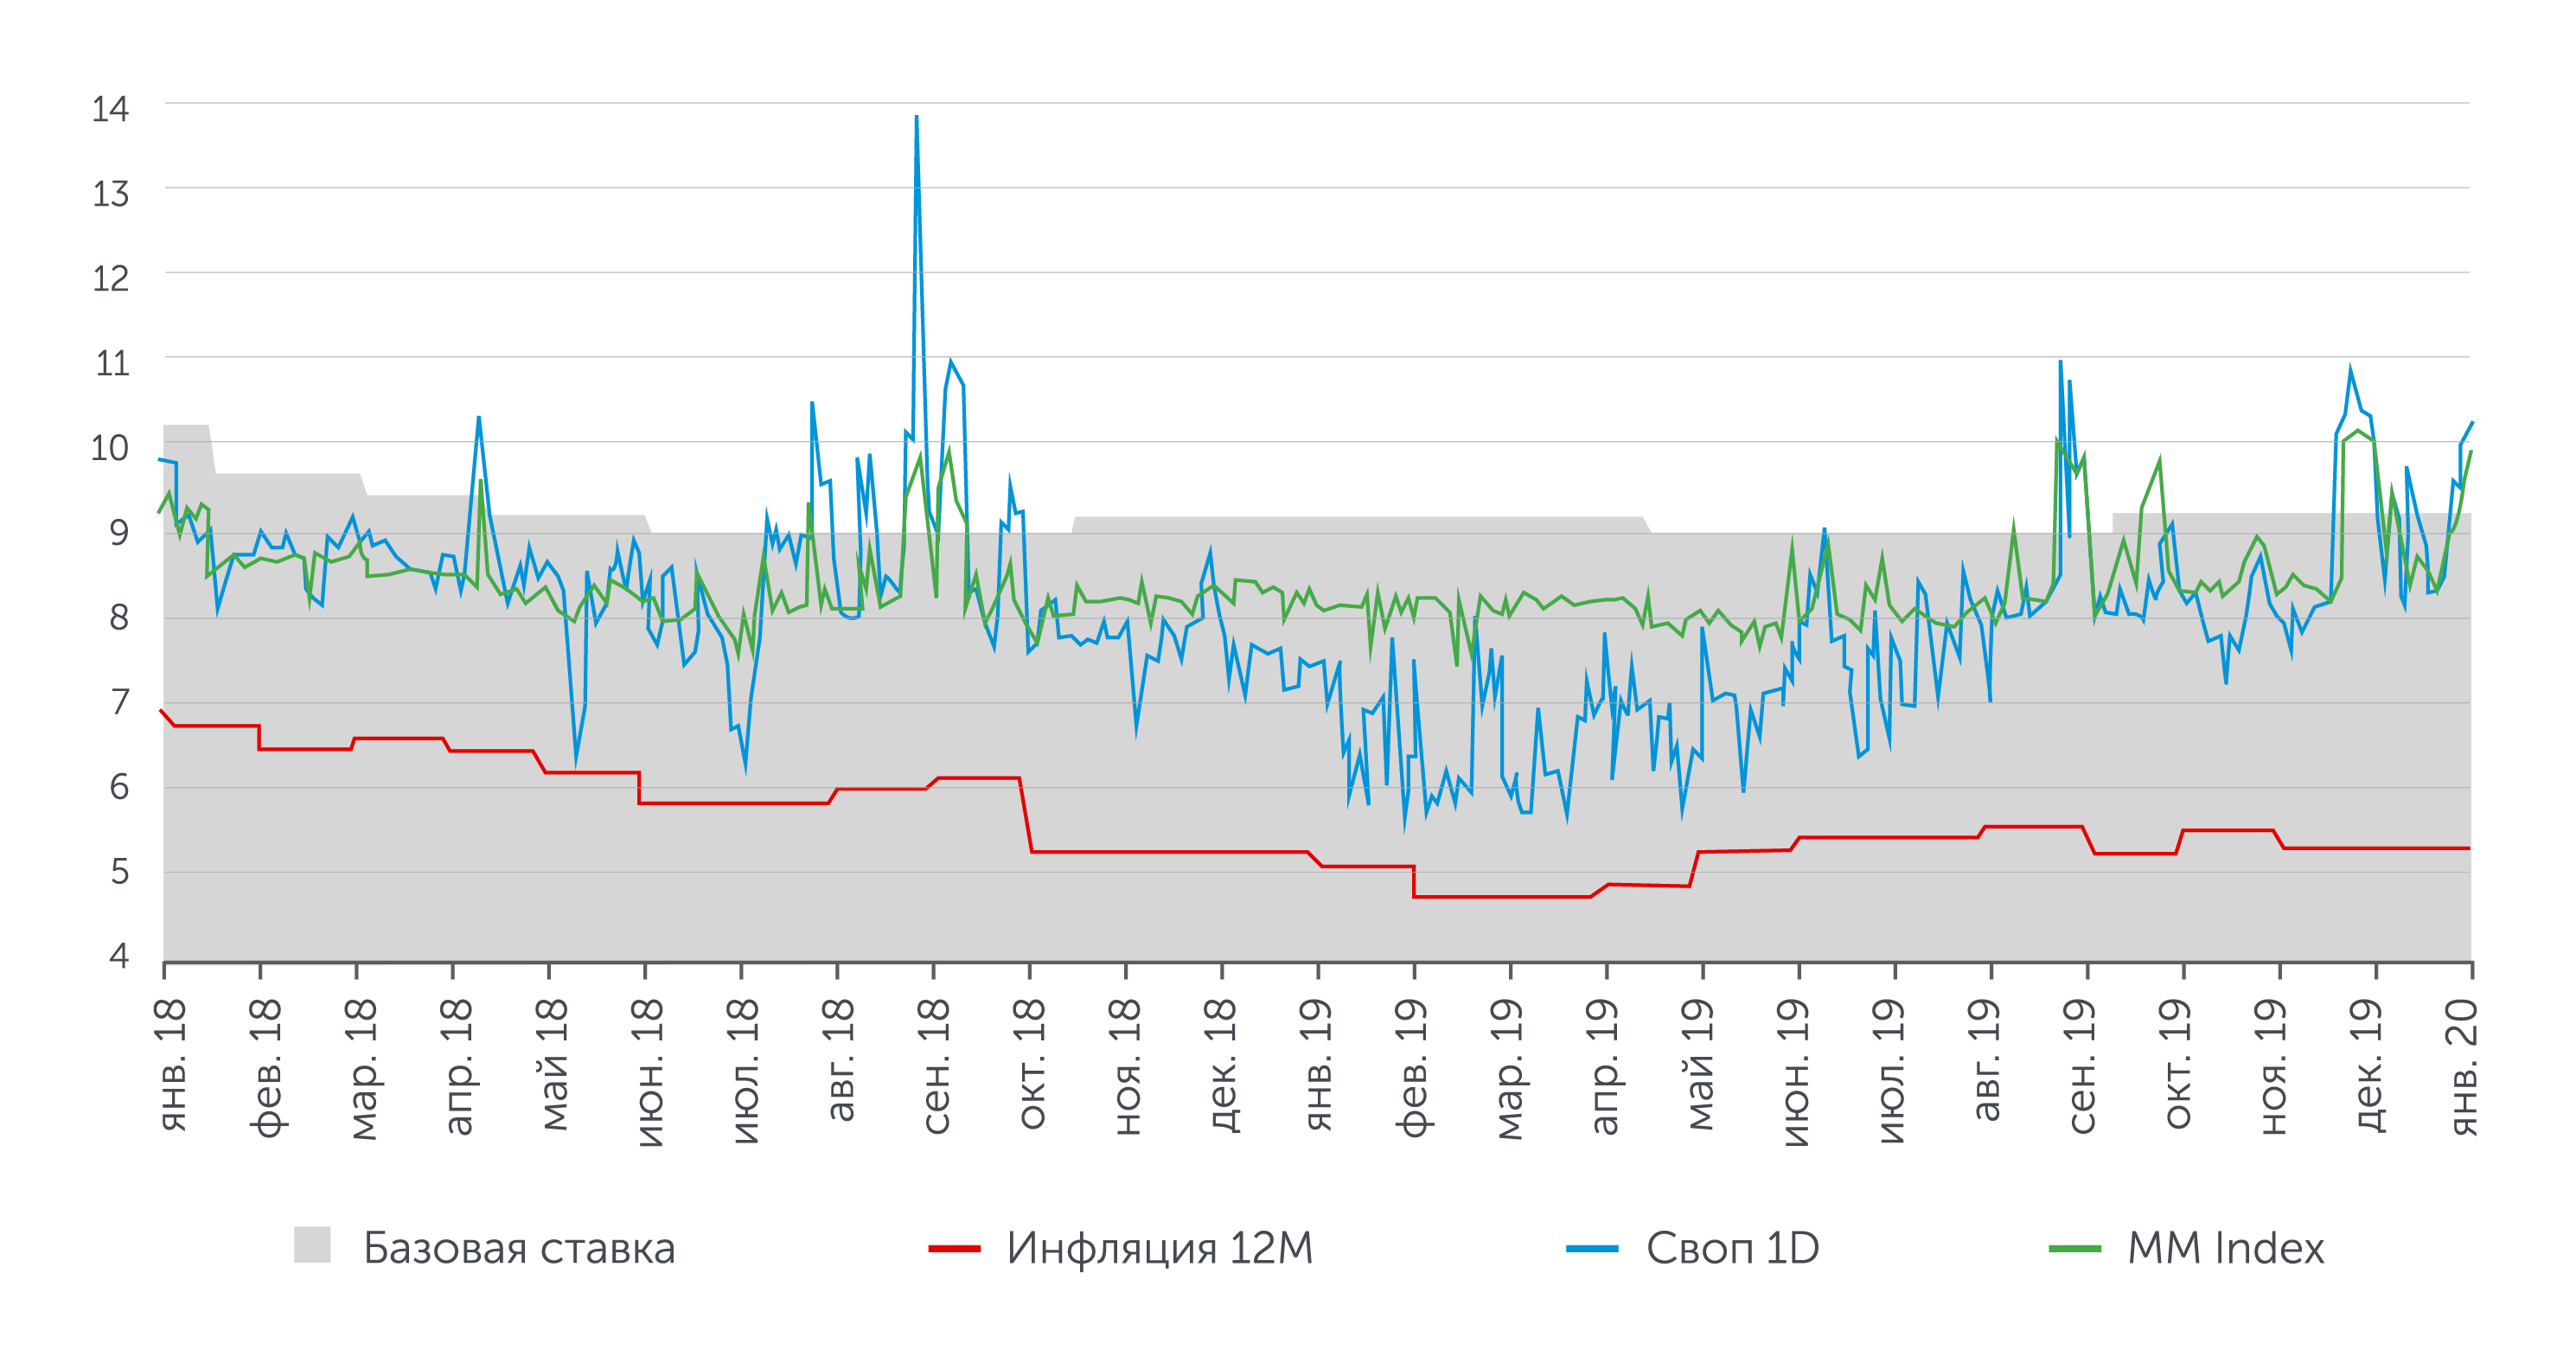
The TONIA money market indicator was relatively stable in the first five months with an average value of TONIA of 8.19%, and in the following months the volatility amplitude has increased and the average TONIA was 8.6% from June to December. The average value of TONIA indicator for the year was 8.43% APR.
The TWINA monetary indicator repeated the form of TONIA volatility, but with a lower amplitude of fluctuations, the average value was 8.55% APR for the 12 months of 2019.
Fig. 18. Trading volume on repo transactions market, KZT bn
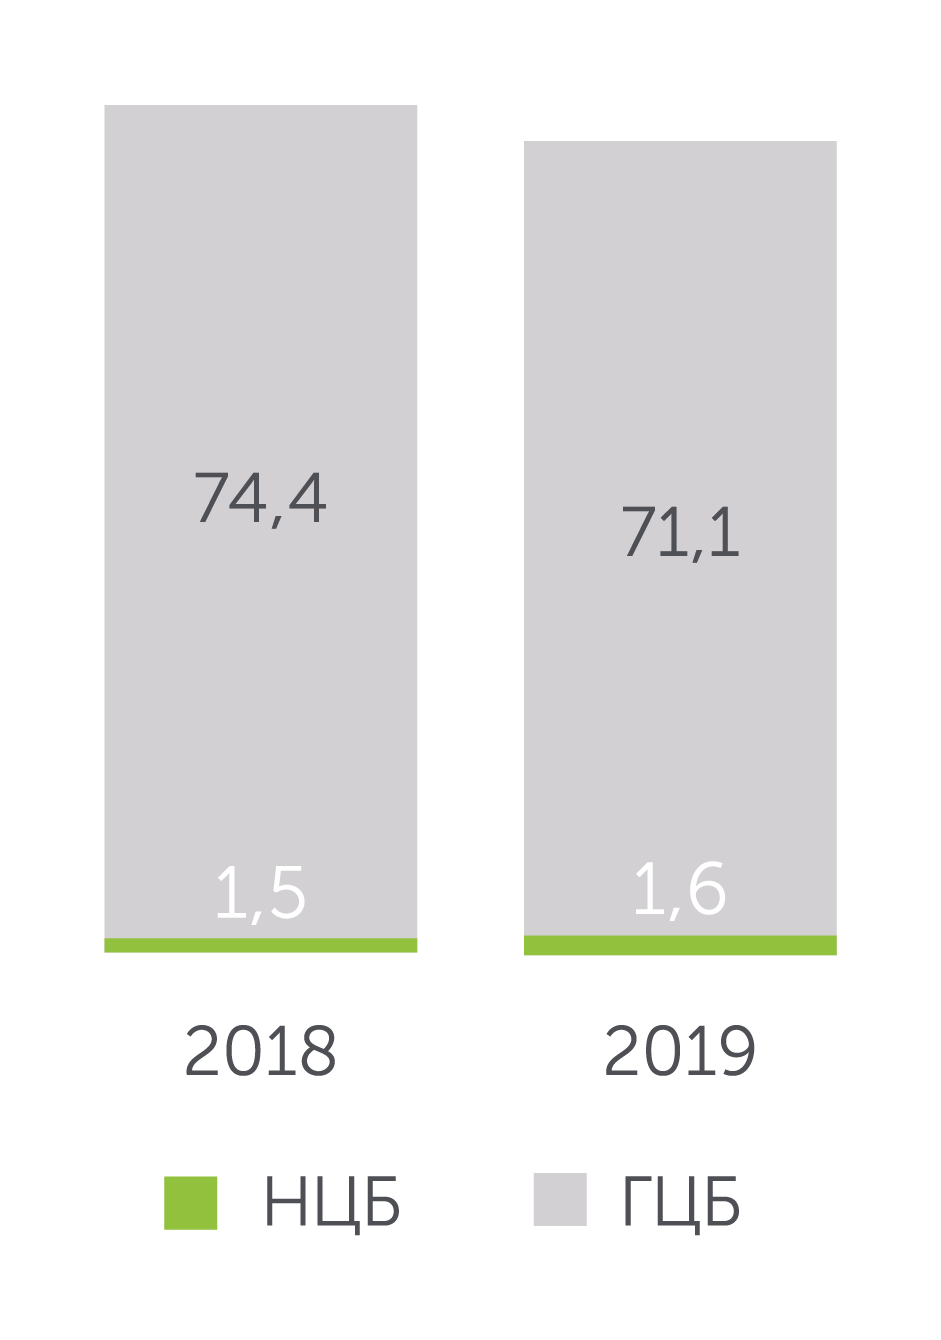
Fig. 19. Inflation and interest rates in Kazakhstan, % APR
CURRENCY SWAP TRANSACTIONS
The total volume of currency swap transactions dropped from KZT33.6 trillion in 2018 to KZT29 trillion in 2019 or by 13.9%.
The average monthly volume of currency swap transactions in 2019 was KZT2,416.5 bn.
The transactions with the USD/KZT currency pair account for 99.9% of currency swap transactions.
Fig. 20. Trading volume in the currency swap market, KZT trln
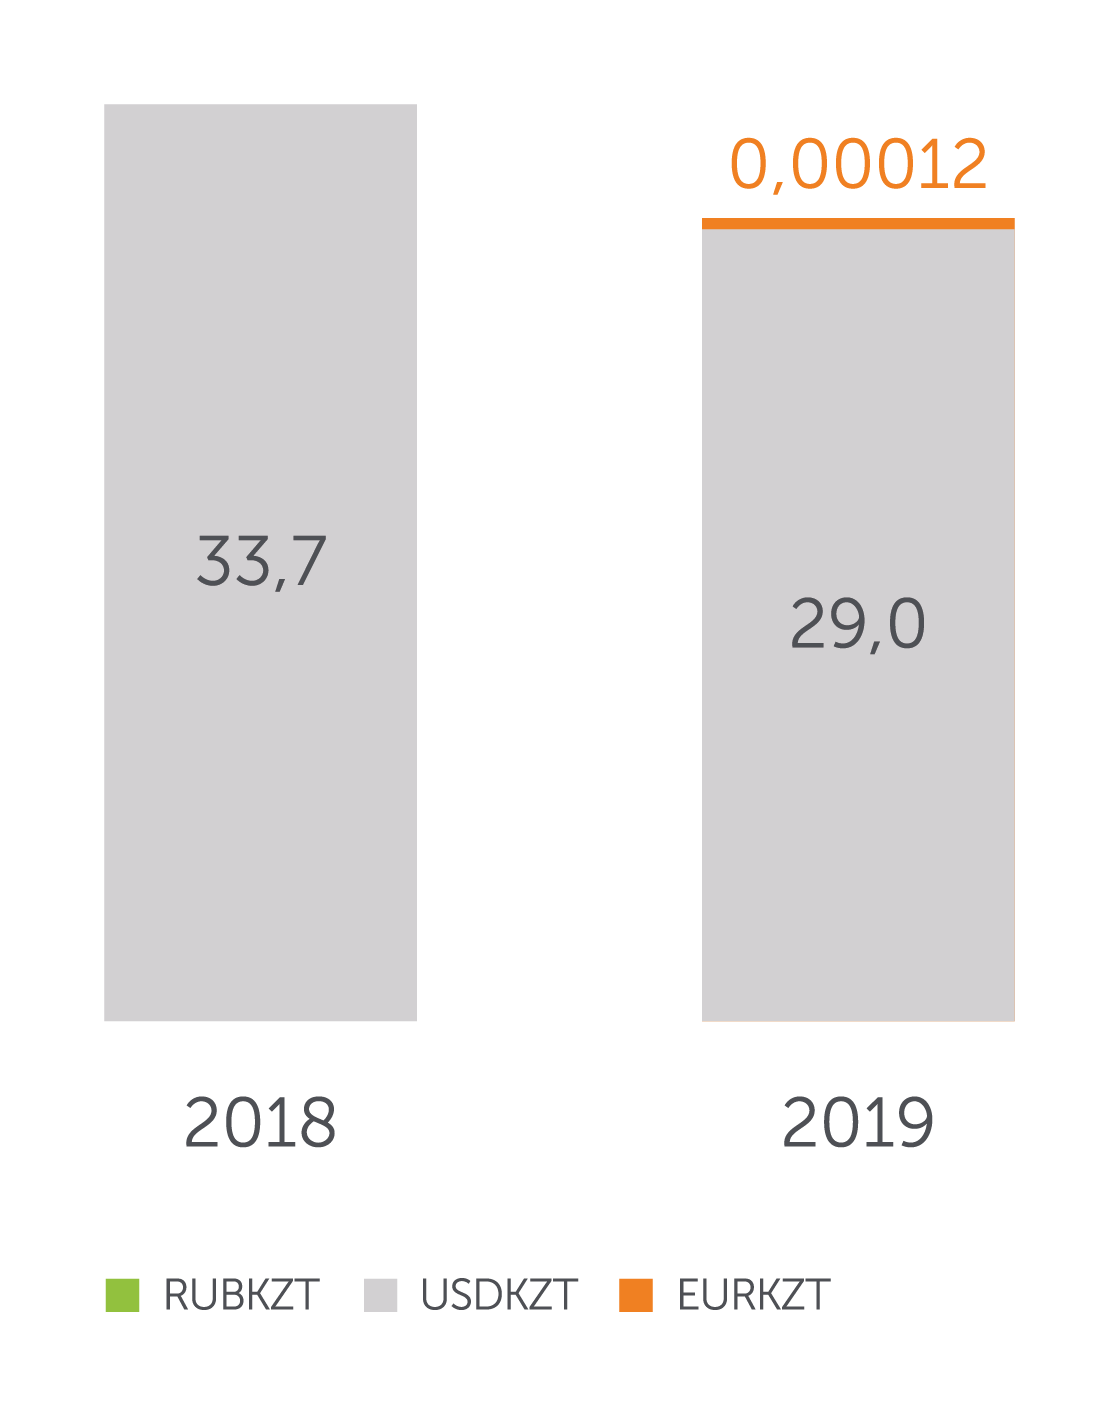
In 2019, currency swap transactions with the EUR/KZT currency pair were conducted for the first time; their total amount amounted to KZT128 mln. The volume of transactions with the RUB/KZT currency pair dropped from KZT219.5 mln in 2018 to KZT174.5 mln, a decrease of 20.5%.
Rates of currency swap transactions on the U.S. dollar peaked at 11% APR for USDKZT_1D and 10.19% APR for USDKZT_2D in 2019.
In 2019, the Exchange introduced instruments for executing currency swap transactions for up to one year, which was a significant progress in the development of the market. The new instruments provide greater opportunities for currency risk hedging and currency position management.
FOREIGN
EXCHANGE MARKET
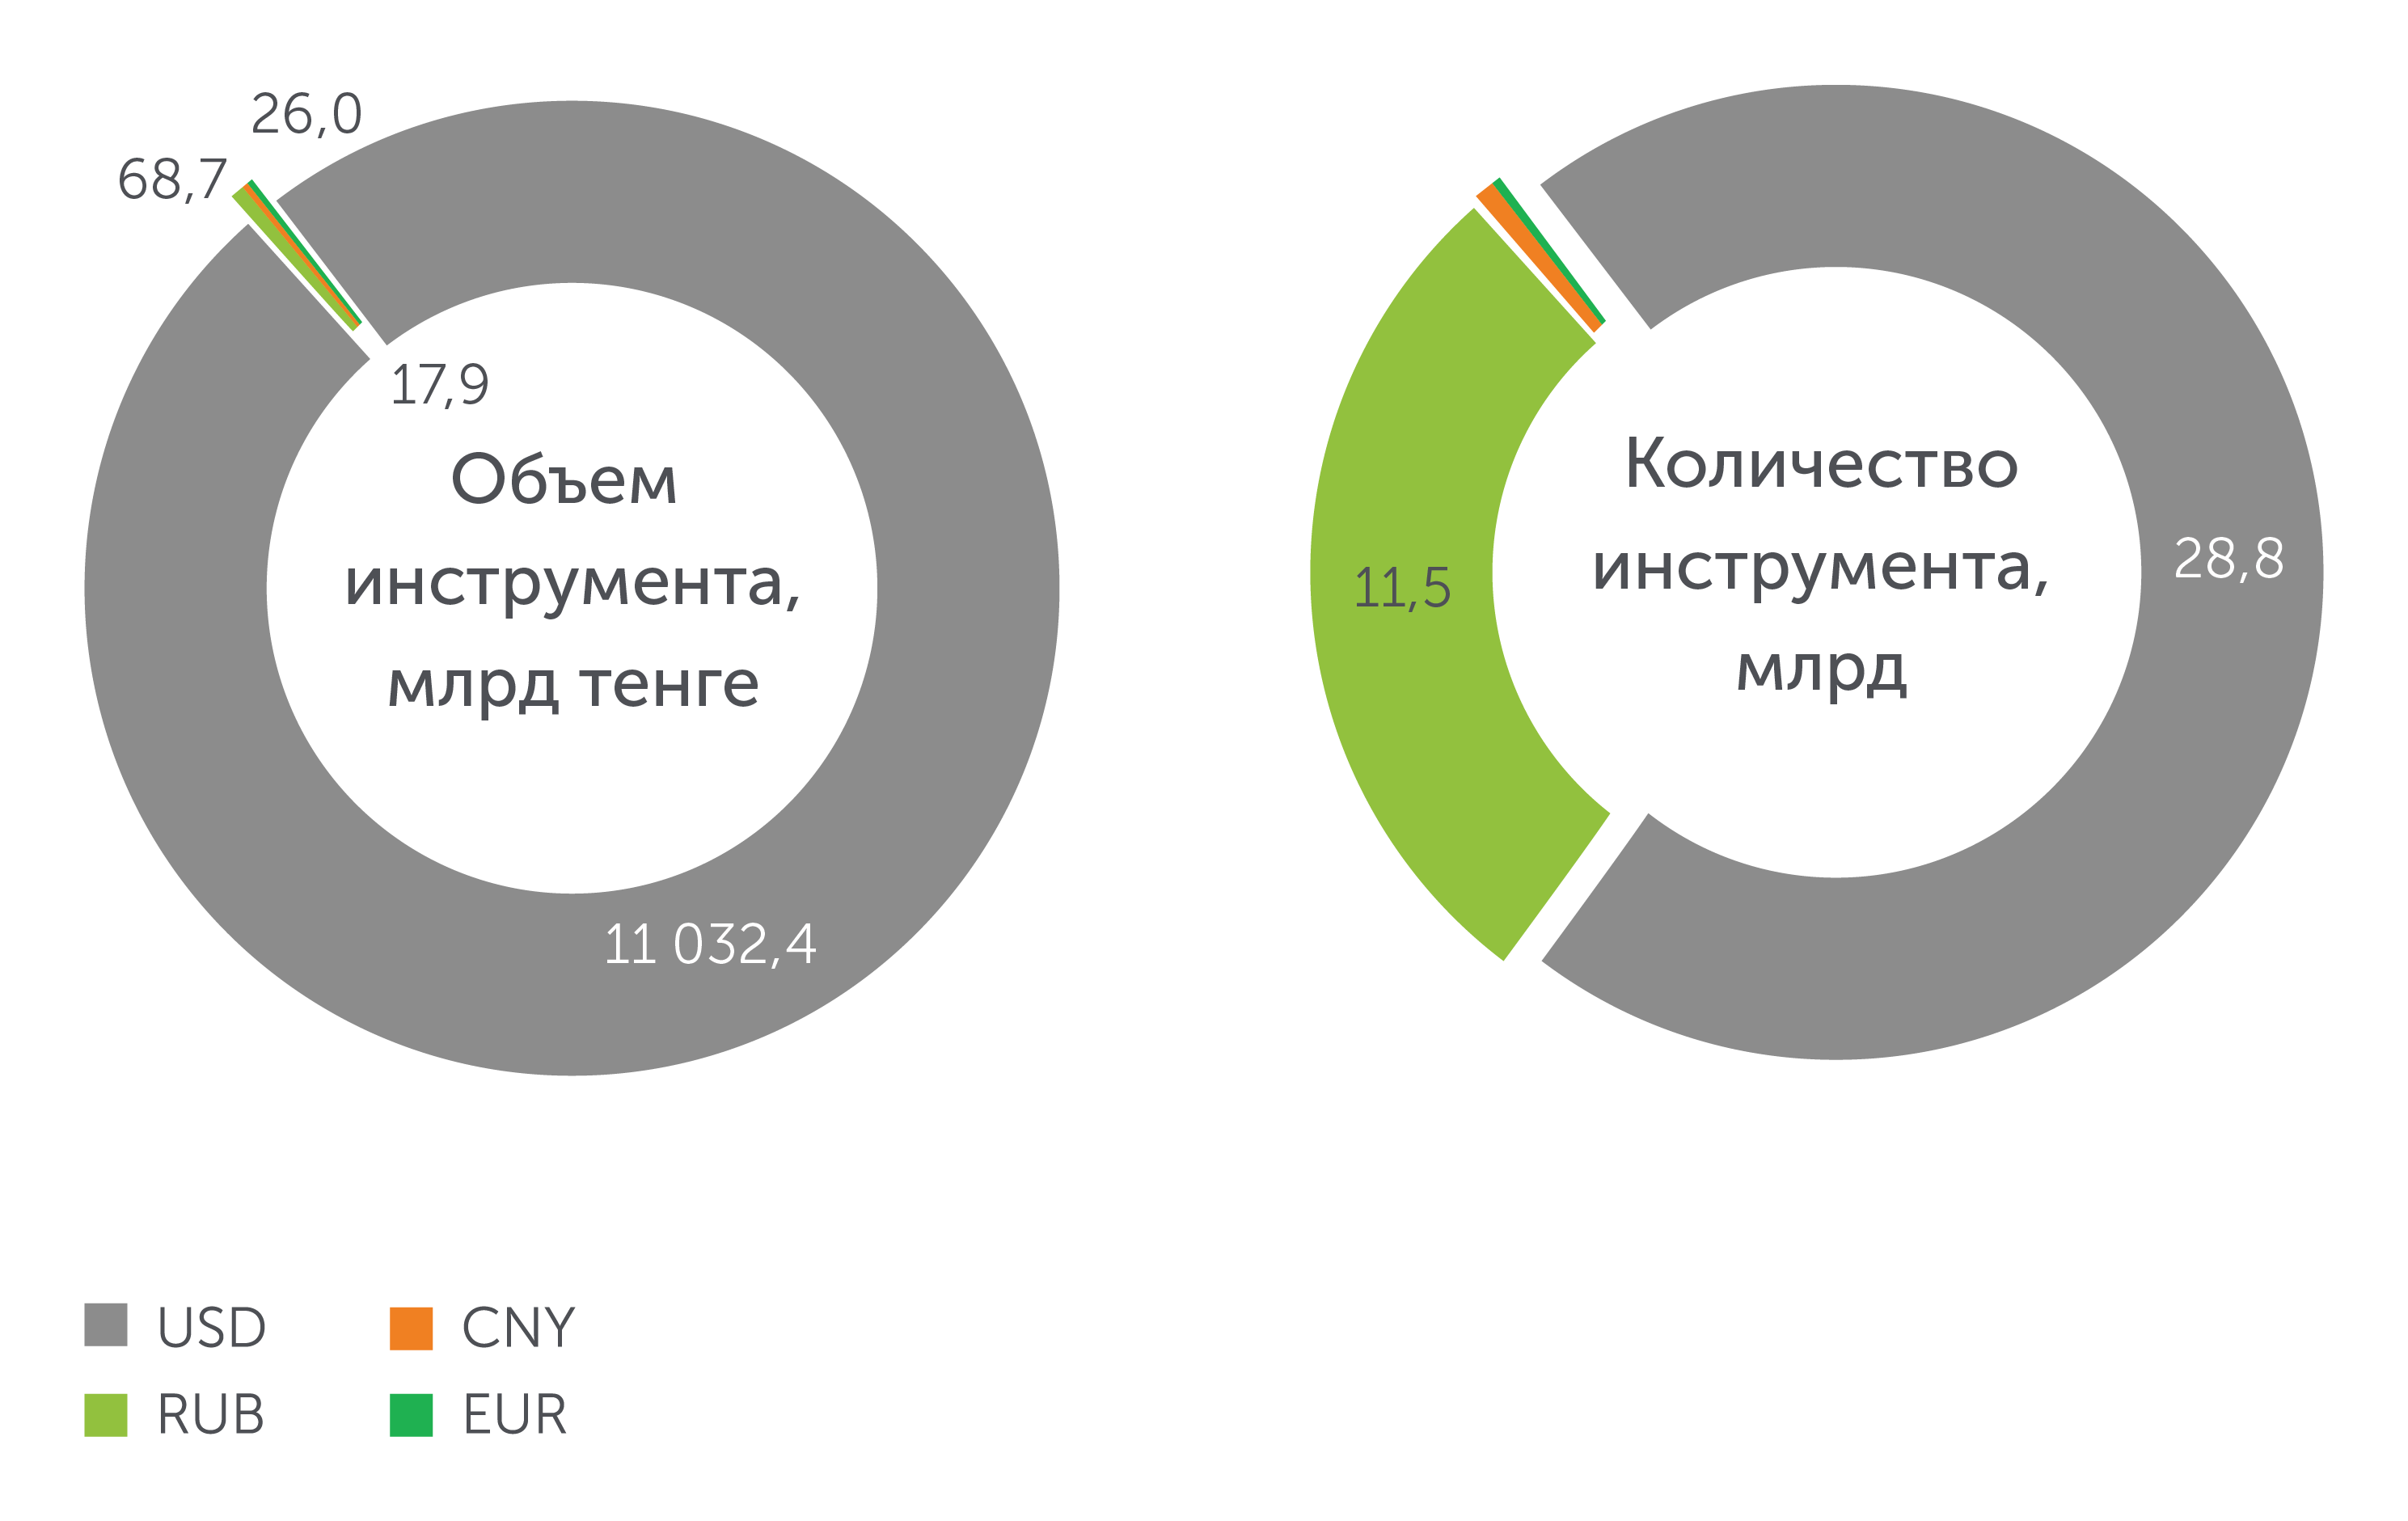
Trading volume on the foreign exchange market amounted to KZT11.1 trillion, which is lower by 17.1% or KZT2.3 trillion than the last year. Since the beginning of the year, 33 KASE members have taken part in foreign exchange trading. The average daily trading volume amounted to KZT45.3 bn, average number of transactions was 324, and average volume of one transaction was KZT139.9 mln.
In 2019, the volatility of the exchange rate was moderate. The spread between the bid and the ask exchange rates of KZT to USD in the exchange market has been consolidating within the range from 0 to KZT0.4 since April compared to the range from 0 to KZT1.0 in Q1 2019. According to the official website of the NBRK, the regulator did not intervene in the domestic foreign exchange market in 2019.
Fig. 22. Dynamics of assets over 5 years, KZT bn
form
Try later...