
OVERVIEW
OF THE RESULTS
TRENDS IN INTERNATIONAL STOCK MARKET
The year 2019 ended with positive results for all world stock markets. Stock indices soared to record highs and their growth was the basis for the rise in market activity in 2019. The main drivers of the growth of markets were shares of companies in the technology sector, health care and consumer goods of selective demand.
The main event in the world economy in 2019 was the trade war between the United States and China. The U.S. and Chinese trade turnover amid protracted trade war between the two largest economies amounted to US $541.2 billion in 2019, which is 14.6% lower than in 2018. The slowdown in the world economy and trade wars significantly affected European countries. The Eurozone GDP growth slowed to 1.2% and business activity in the region's industry weakened to its highest level in the last seven years. A key factor for the commodity market in 2019 was the agreement of the OPEC+ countries to cut oil production, which allowed balancing supply and demand in the energy market, and keeping prices from sharp increases.
The following are the key indicators of the world stock market compiled based on the WFE data:
- Global equity market capitalization increased by 22.9% compared to 2018 and amounted to US $94 trillion. The growth was observed in all WFE regions. Capitalization in the EMEA regions (Europe, Middle East and Africa), America (North and South America) and Asia Pacific increased by 31.48%, 21.10% and 16.69% respectively;
- Global stock trading volume in 2019 compared to 2018 decreased by 16% and amounted to US $21 trillion. Growth in volumes was observed only in the Asia-Pacific region and amounted to US $7.2 trillion against US $6.1 trillion a year earlier. The main reason for the growth in this region was the Shenzhen and Shanghai stock exchanges. While the U.S. region experienced a drop from US $16 trillion to US $10.9 trillion.
At the end of 2019, KASE ranks 51st among the 70 members of WFE in terms of equity market capitalization, showing an increase of 9.8% compared to the last year. The Saudi Stock Exchange was an absolute leader in capitalization growth for 2019, showing an increase of almost 385%. The volume of trading in bonds on KASE reached US $13 billion, which is 25.1% more than in 2018, and made KASE the 21st among the WFE members.
Fig.1. Equity Market Capitalization of World Stock Exchange, bn USD
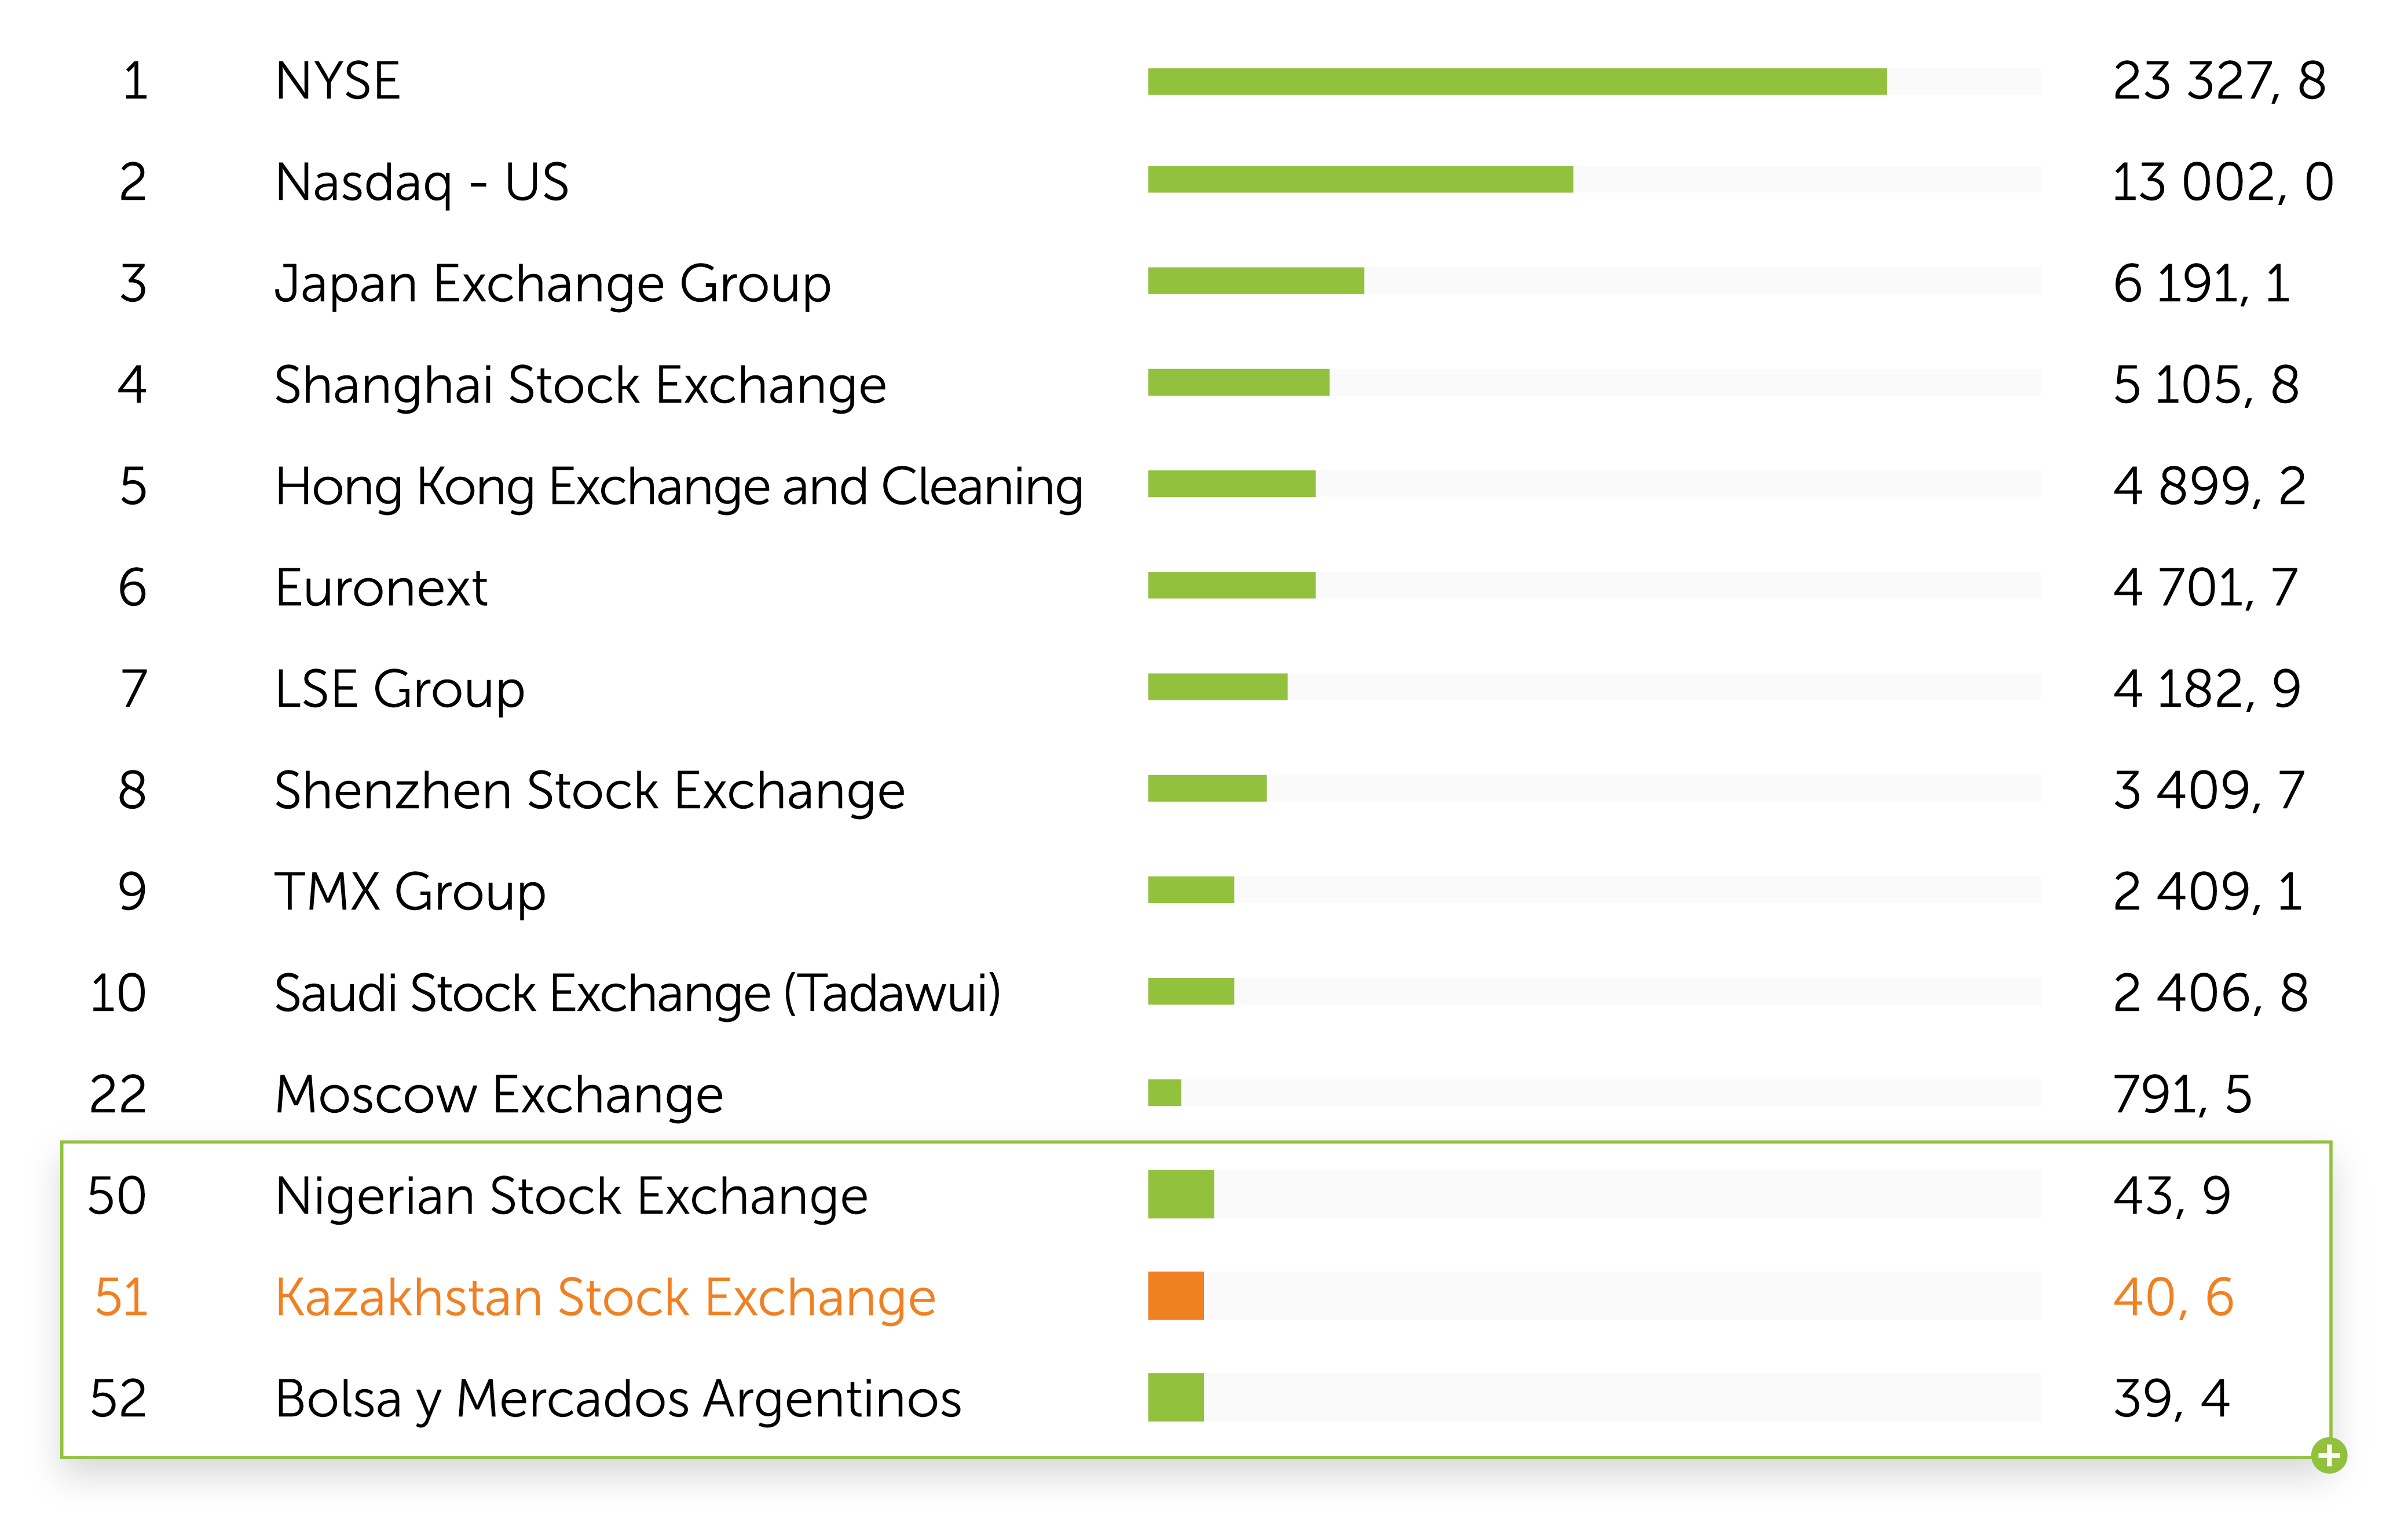
Source: World Federation of Exchanges (WFE)
Fig.2. Share Trading Volume on World Stock Exchanges, bn USD
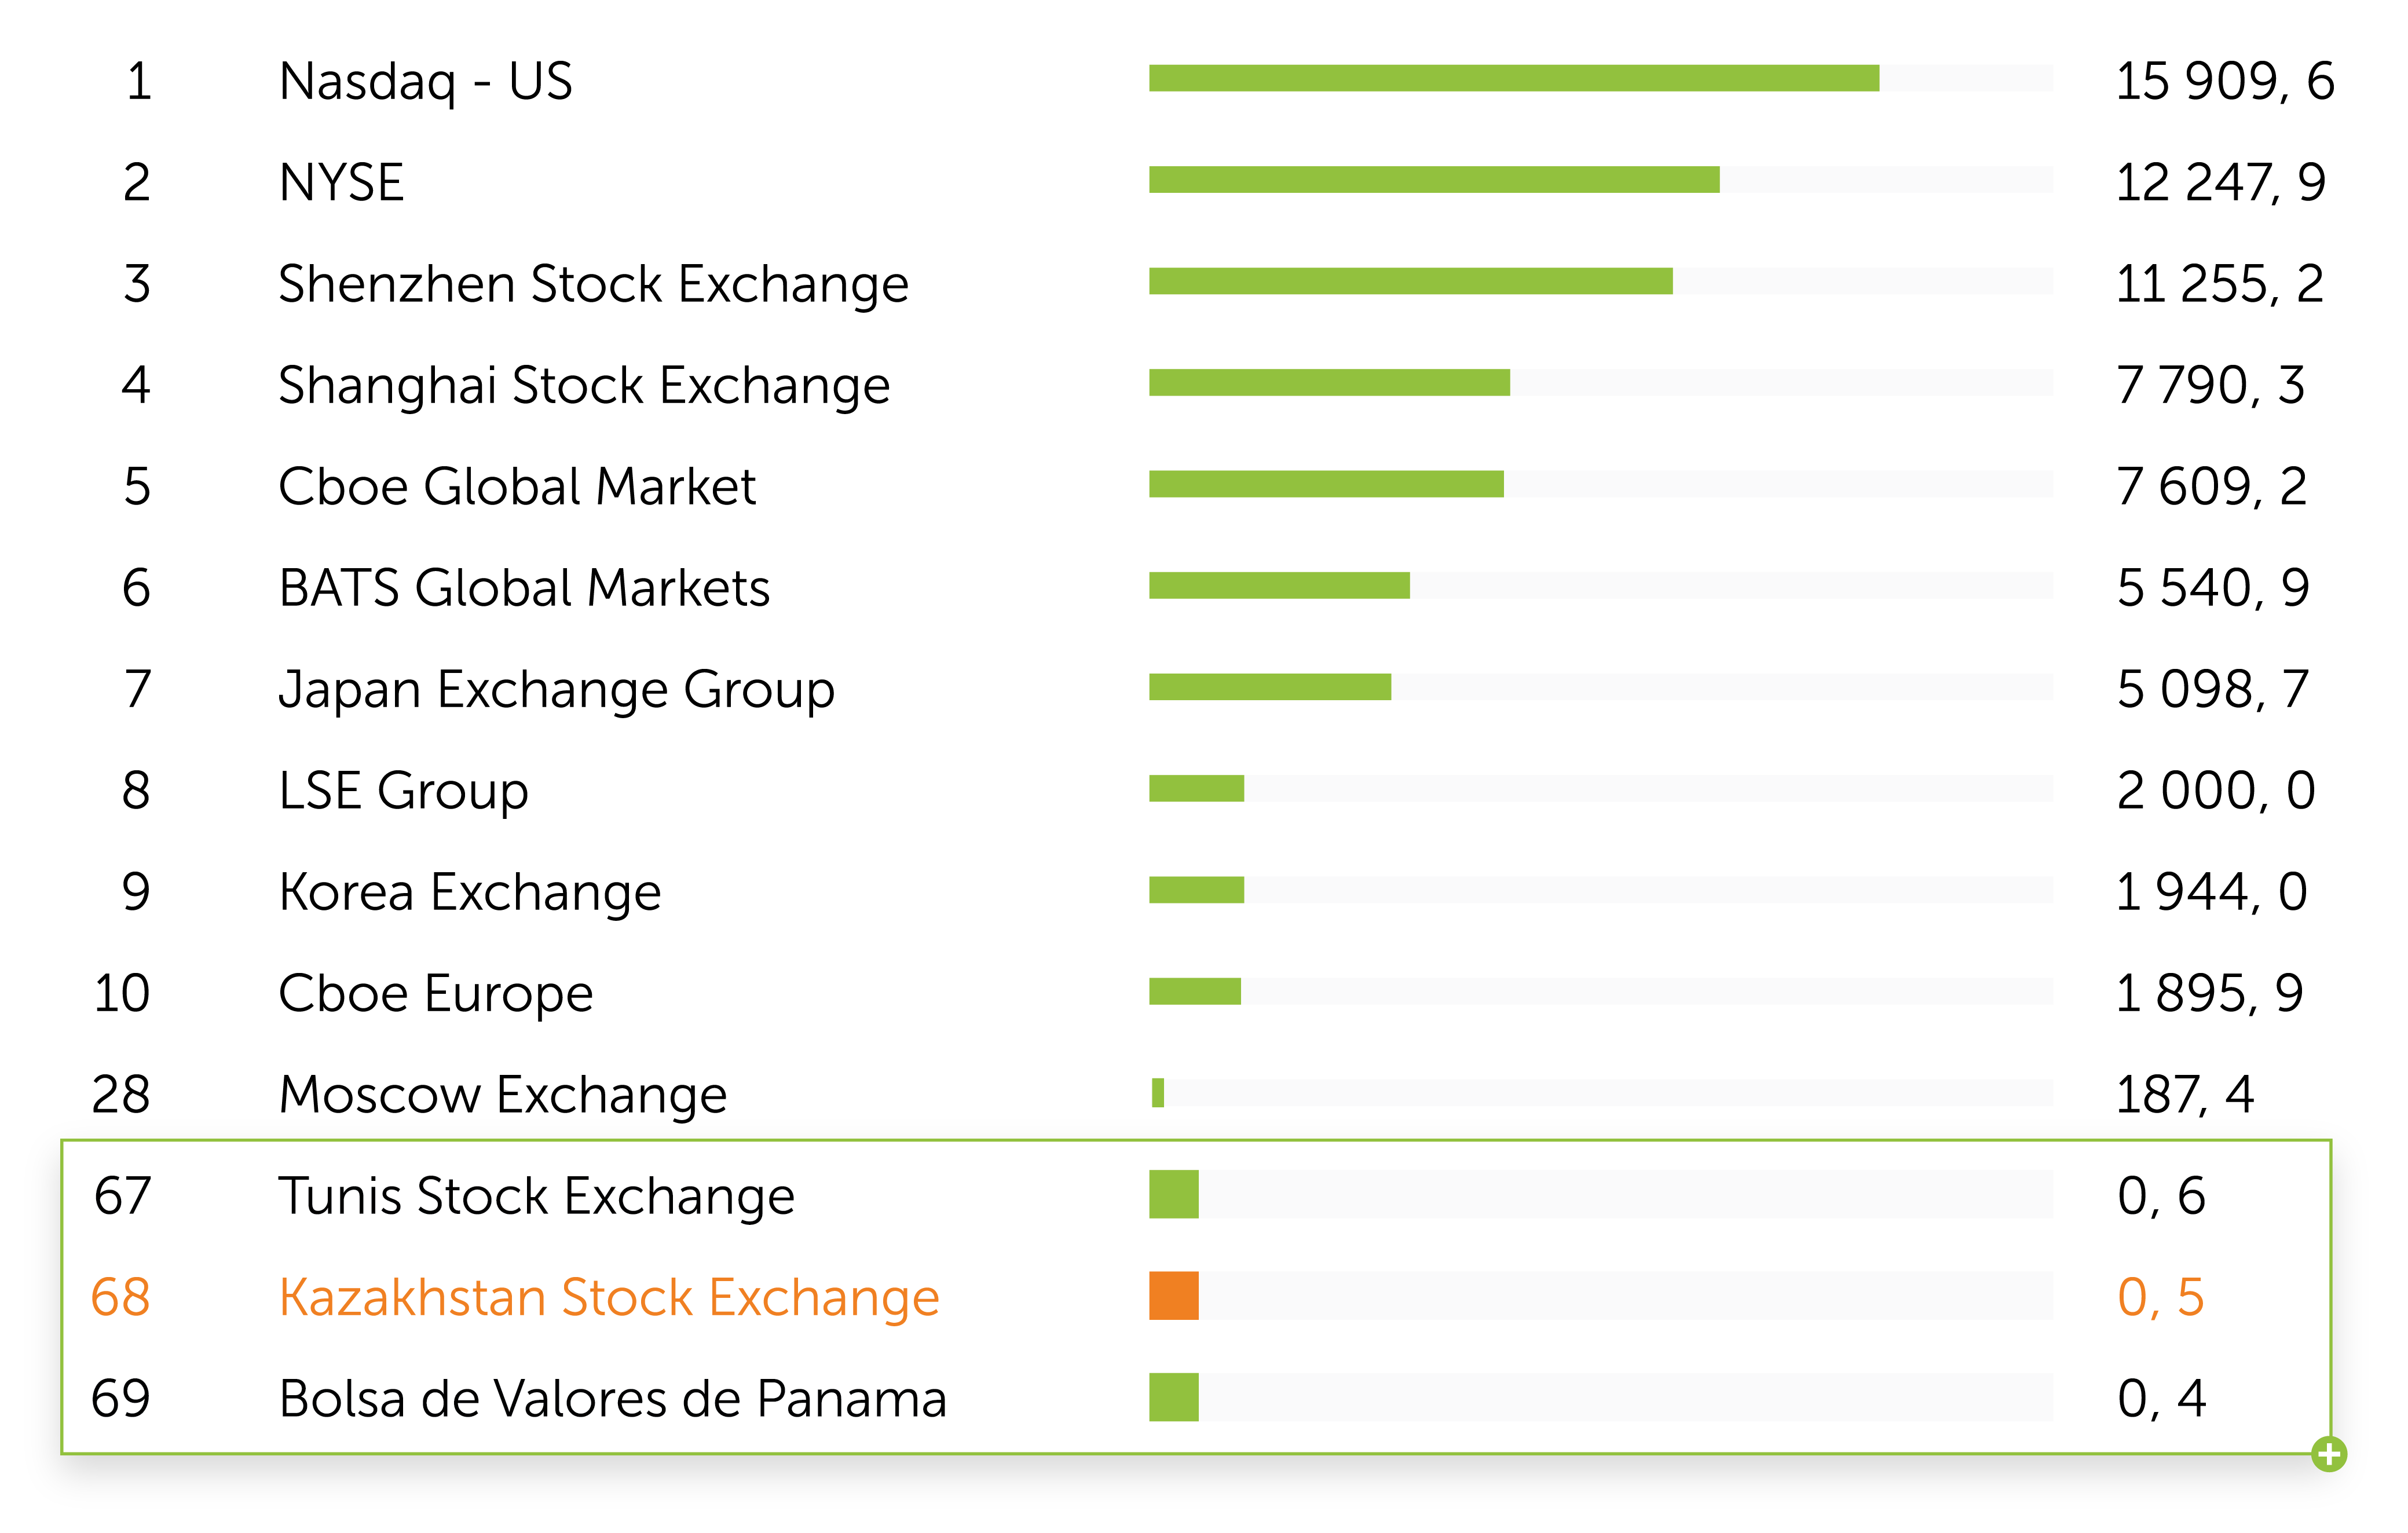
Source: World Federation of Exchanges (WFE)
Fig.3. Trading Volume of Bonds on World Stock Exchanges, bn USD
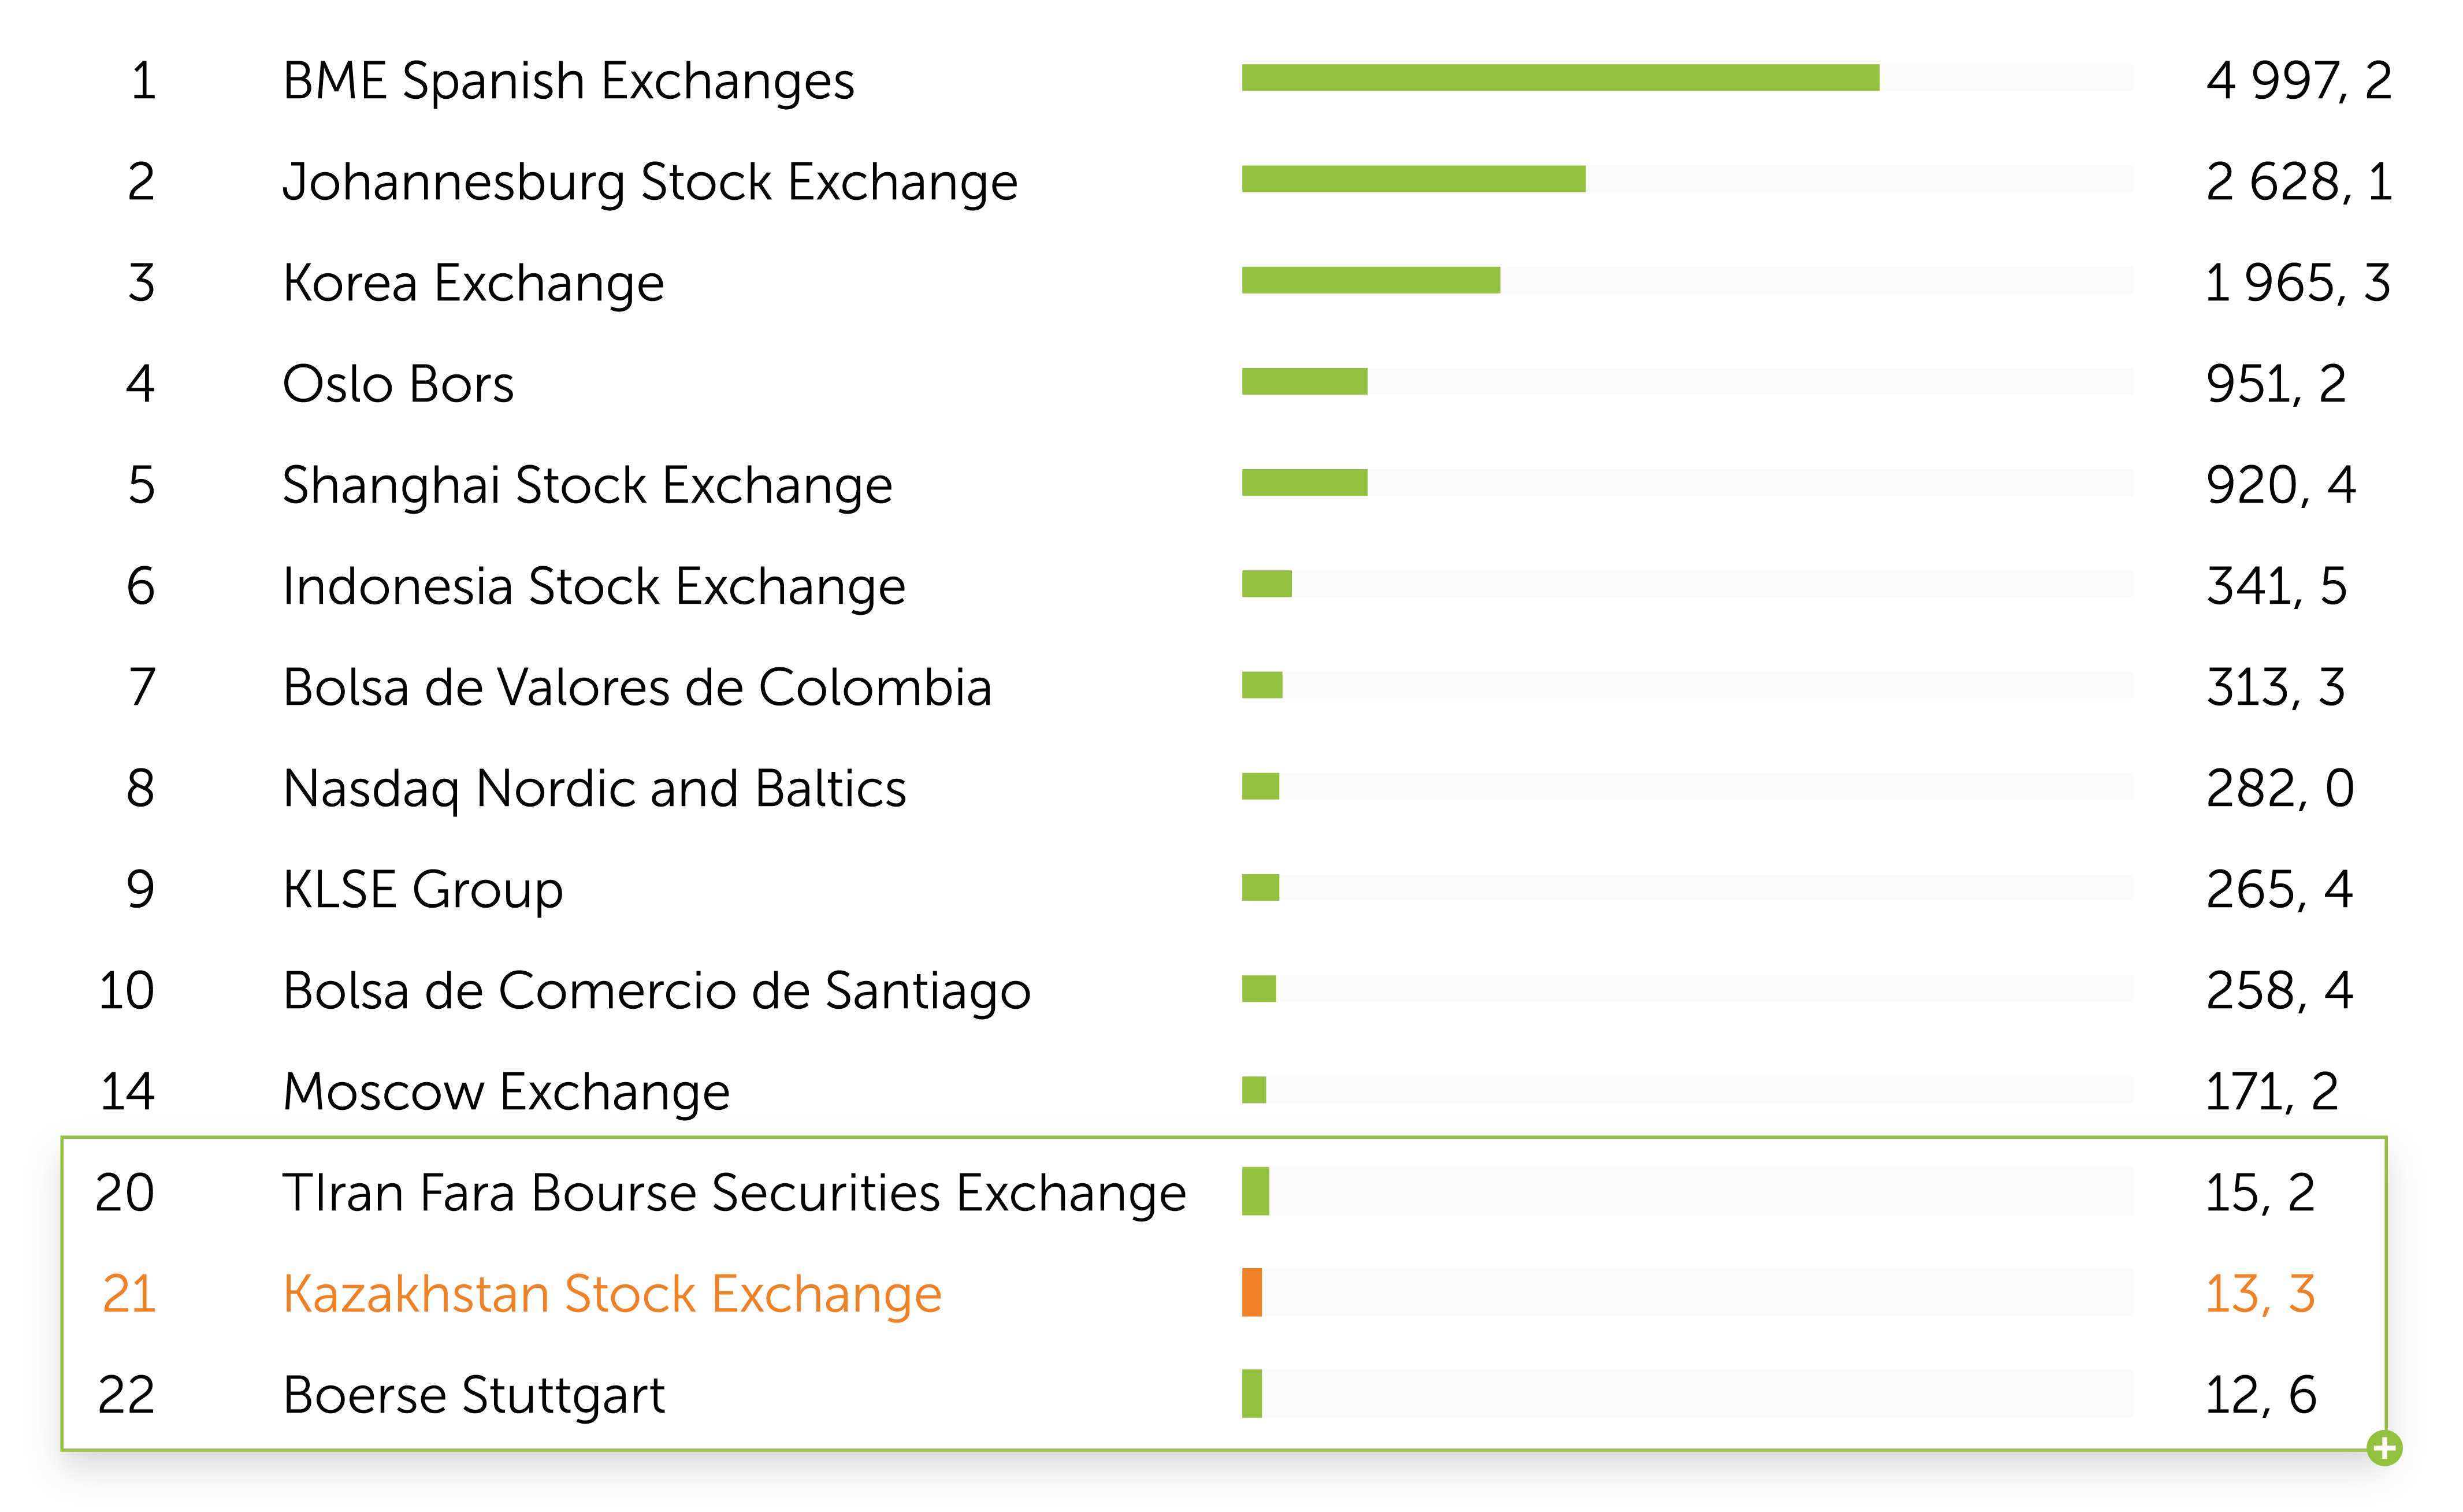
Source: World Federation of Exchanges (WFE)
KASE Index grew by 3% in 2019. Among the top three indices that showed the largest increase in 2019 were stock market indices of developing countries. Indices of Argentina, Brazil and Russia have updated their historical highs. The main driver of the growth of indices was the increase of risk appetite of local and foreign investors to the assets of exchange markets due to the improvement of credit qualities of issuers, relative stability of exchange rates, positive macro statistics of these countries, as well as the transition of central banks to a soft "stimulating" policy. The below is a diagram of changes in major stock indices and KASE Index for 2019.
Fig. 4. Growth indicators of major global stock indices and KASE Index in 2019, %
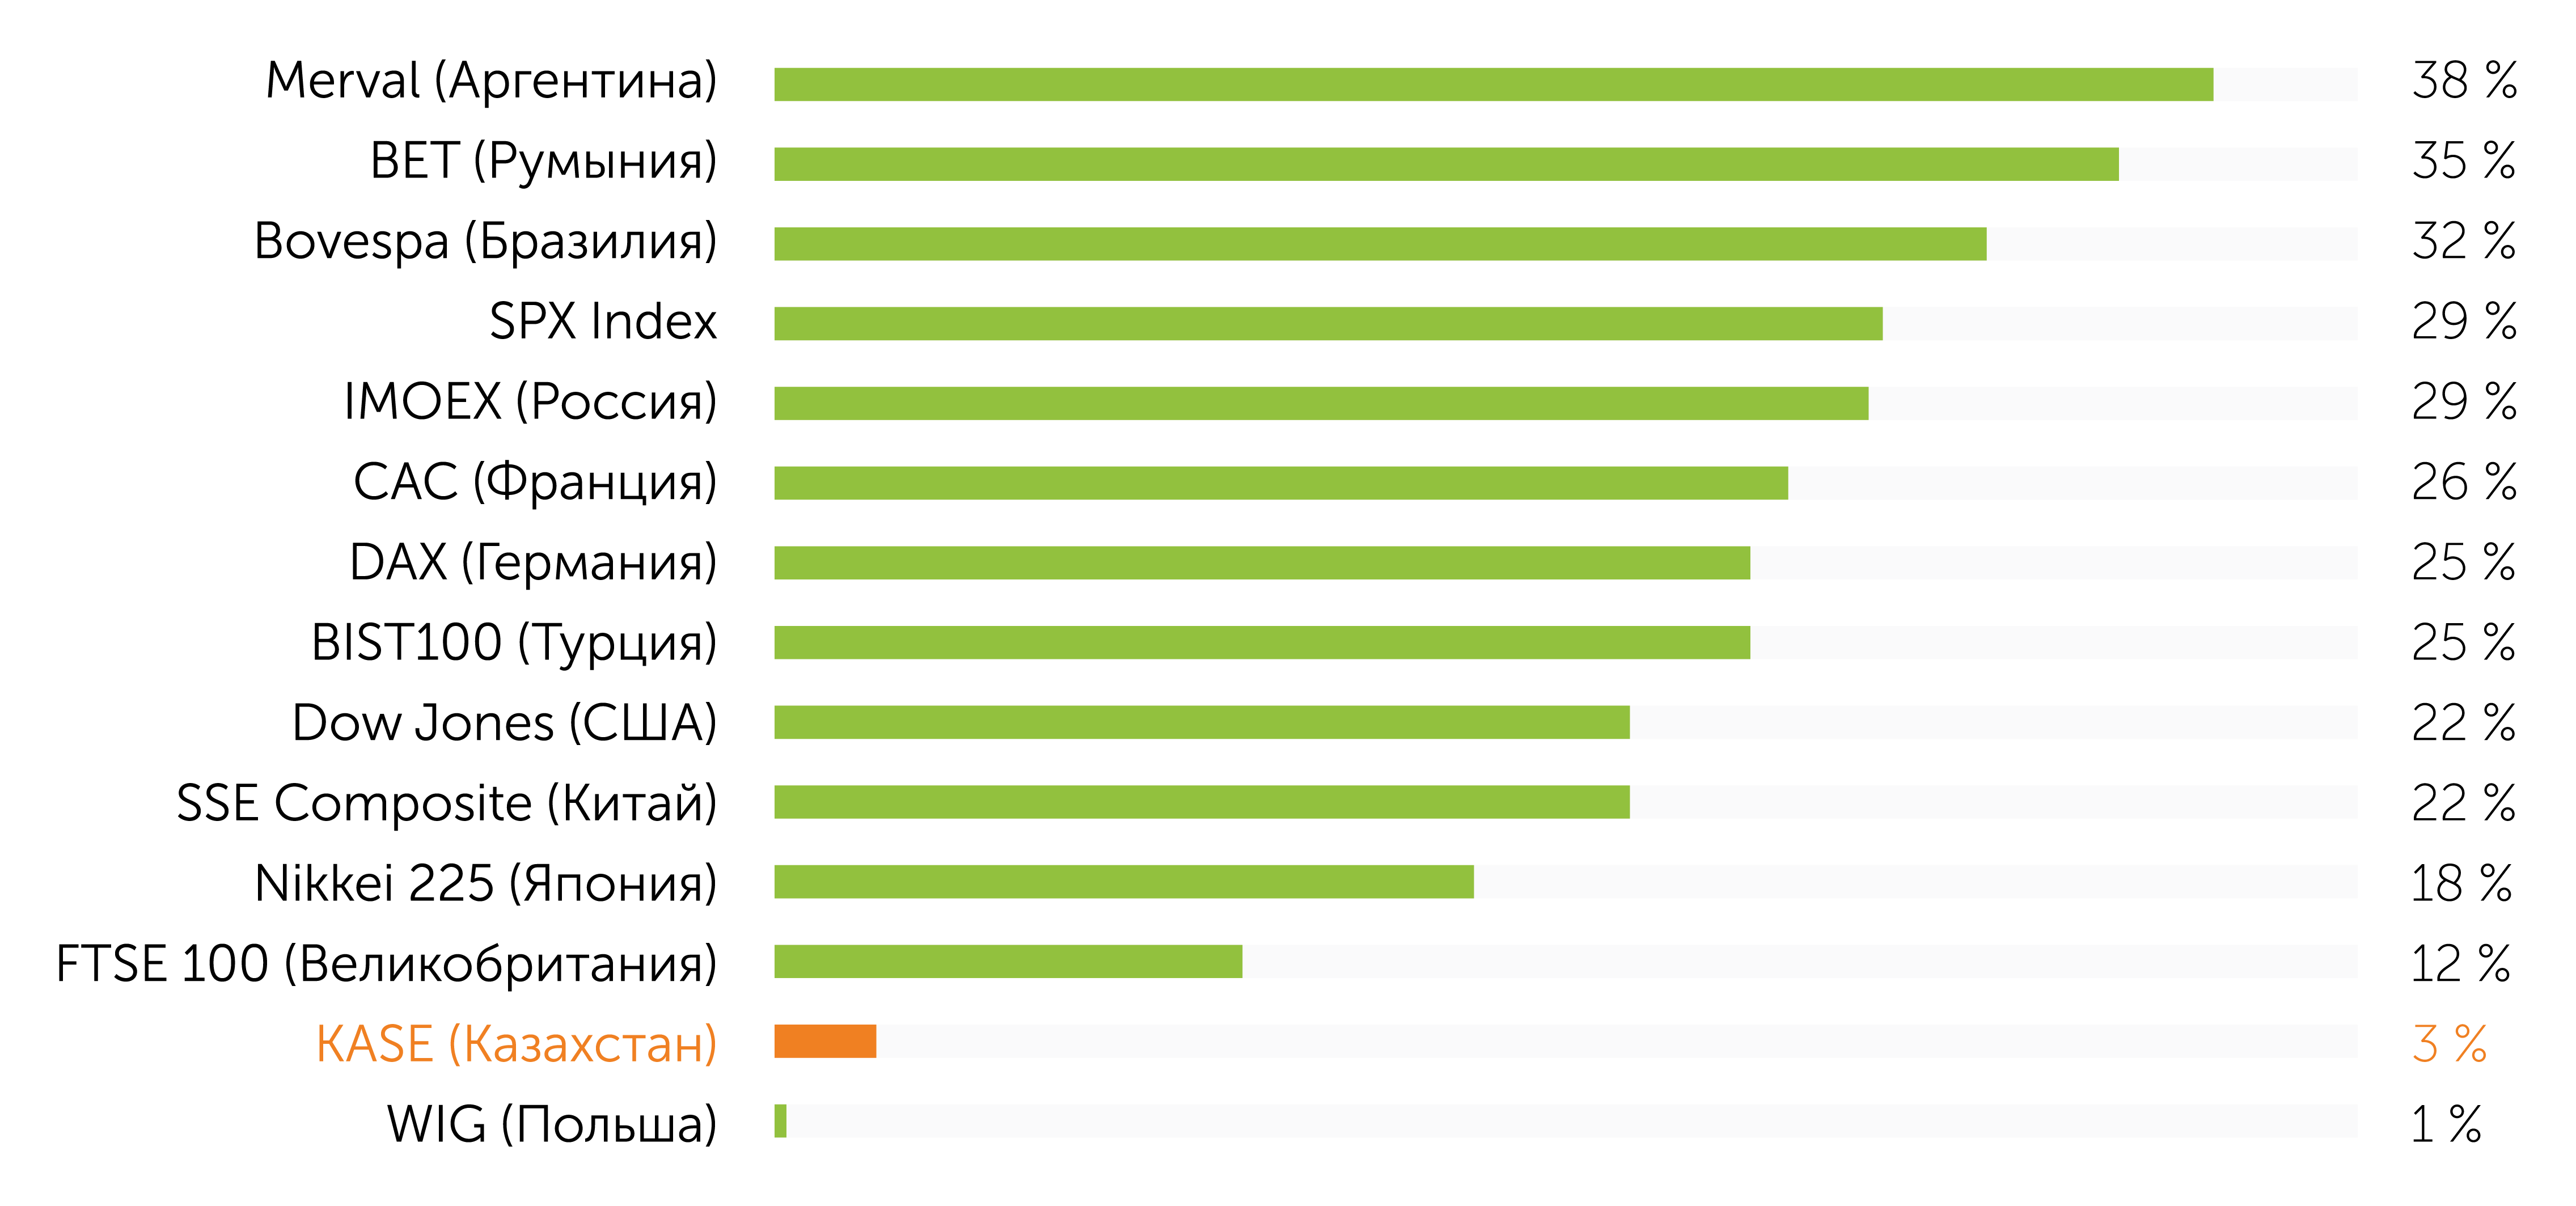
Source: Bloomberg
form
Try later...